
- Title
-
Establishment and characterization of adap1-deficient zebrafish
- Authors
- Kawahara, A., Yasojima, S., Koiwa, J., Fujimaki, S., Ito, H., Yamada, M., Kosaki, K., Nishimura, Y.
- Source
- Full text @ Dev. Growth Diff.
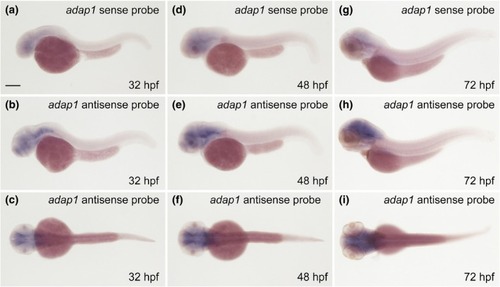
Expression of EXPRESSION / LABELING:
|
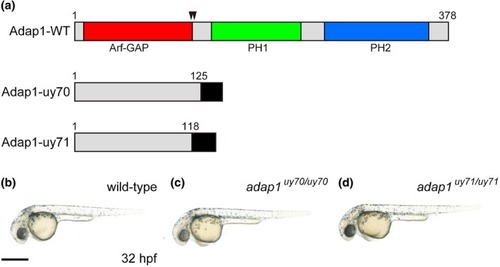
Establishment of PHENOTYPE:
|
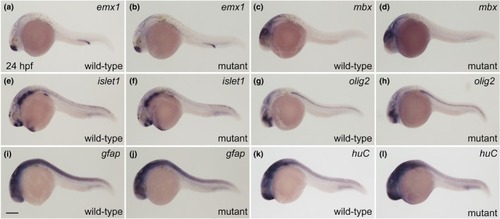
Neural gene expression in wild‐type and EXPRESSION / LABELING:
|
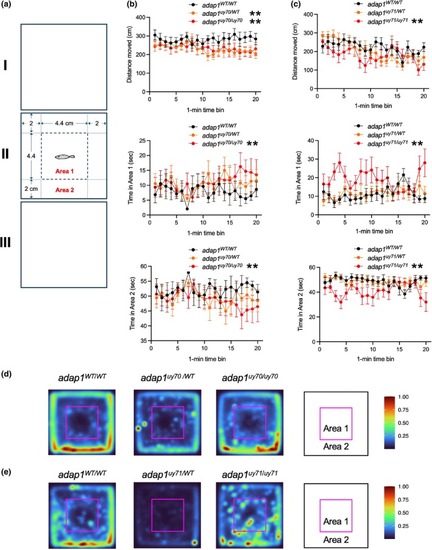
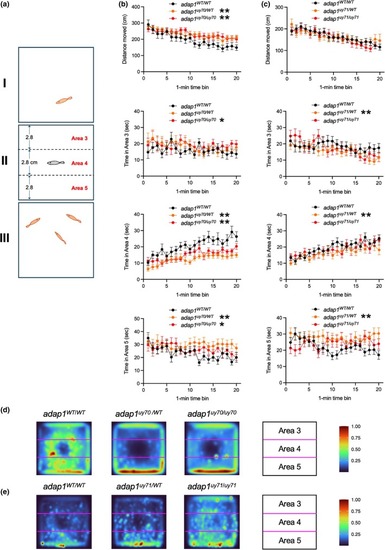
Open field test of wild‐type and PHENOTYPE:
|
Social behavior analysis of wild‐type and PHENOTYPE:
|