FIGURE

FIGURE 4

ID
ZDB-FIG-250417-105
Publication
Kawahara et al., 2025 - Establishment and characterization of adap1-deficient zebrafish
Other Figures
All Figure Page
Back to All Figure Page
FIGURE 4

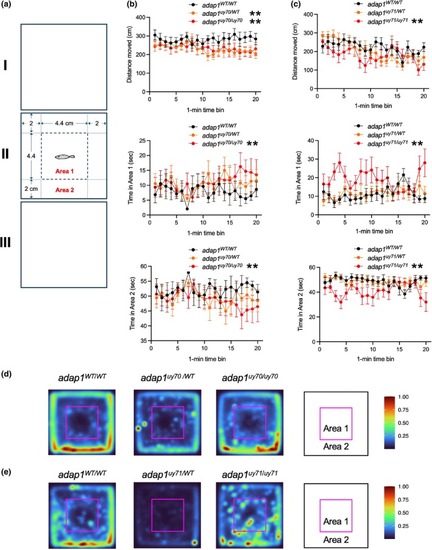
Open field test of wild‐type and adap1 mutants in the adult stage. (a) Schematic representation of the open field test used in this study. (b and c) The distance moved by zebrafish in chamber II and the time spent in each area (area 1 and 2) for each minute. The distance moved of adap1uy70/WT, adap1uy70/uy70, and adap1uy71/uy71 was shorter than that of wild‐type. The adap1uy70/uy70 and adap1uy71/uy71 stayed longer in area 1 and both stayed less time in area 2. The numbers of zebrafish are Ν = 11 for WT/WT, Ν = 18 for WT/uy70, Ν = 15 for uy70/uy70, Ν = 10 for WT/WT, Ν = 12 for WT/uy71, Ν = 11 for uy71/uy71. *p < 0.05, **p < 0.01. (d and e) Heat map of the behavior of wild‐type and adap1 mutants. The numbers of zebrafish in each group are same in (b and c). A high number of color indicators indicates that zebrafish were frequently located at that position during the 20 min test period.

Expression Data

Expression Detail
Antibody Labeling
Phenotype Data
Fish:
Observed In:
Stage: Adult

Phenotype Detail
Acknowledgments
This image is the copyrighted work of the attributed author or publisher, and ZFIN has permission only to display this image to its users. Additional permissions should be obtained from the applicable author or publisher of the image. Full text @ Dev. Growth Diff.