
FIGURE
FIGURE 3
- ID
- ZDB-FIG-250417-104
- Publication
- Kawahara et al., 2025 - Establishment and characterization of adap1-deficient zebrafish
- Other Figures
- All Figure Page
- Back to All Figure Page
FIGURE 3
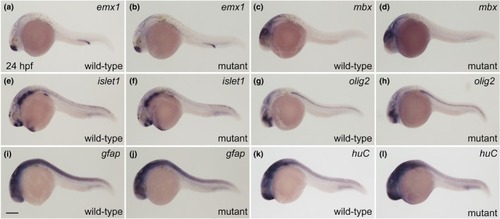
Neural gene expression in wild‐type and |
Expression Data
| Genes: | |
|---|---|
| Fish: | |
| Anatomical Terms: | |
| Stage: | Prim-5 |
Expression Detail
Antibody Labeling
Phenotype Data
Phenotype Detail
Acknowledgments
This image is the copyrighted work of the attributed author or publisher, and
ZFIN has permission only to display this image to its users.
Additional permissions should be obtained from the applicable author or publisher of the image.
Full text @ Dev. Growth Diff.