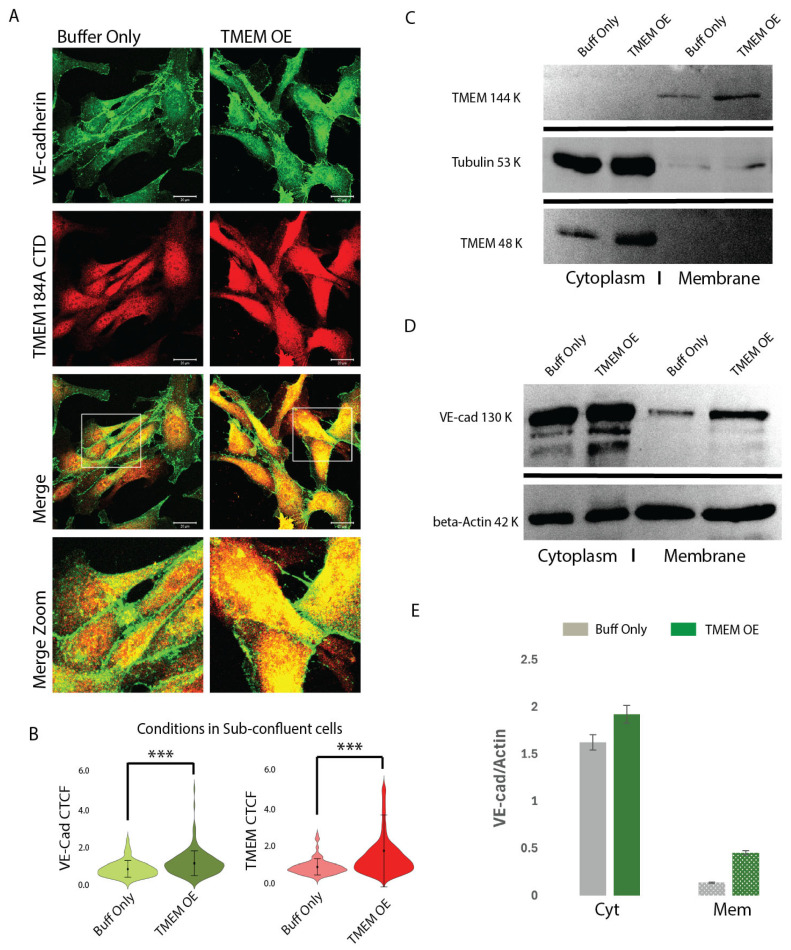
TMEM OE increases VE-cad rapid recycling and membrane levels. (A) Comparisons of VE-cad (green) and TMEM184A CTD (red) staining in mock control and TMEM OE BAOECs. Increased levels of VE-cad and TMEM and VE-cad-TMEM colocalization in TMEM OE are highlighted in merged, white box, zoom, comparisons. Scale 20 μm. (B) Violin plots of corrected total cell fluorescence (CTCF) values of VE-cad and TMEM184A across cells electroporated with buffer only (buff only, light green, and light red violins) and cells electroporated with TMEM-tGFP (TMEM OE, dark green and dark red violins) in sub-confluent BAOECs across three independent experiments, n = 198, *** p < 0.0001. (C) TMEM OE confirmation with TMEM184A CTD staining in cells electroporated with buffer only (Buff only) and cells electroporated with TMEM-tGFP showing TMEM184A CTD (144 kDa, 48 kDa) and Tubulin (53 kDa). (D) Representative WB of subcellular fractionation samples from buff only and TMEM OE cells, VE-cad (130 kDa), beta-actin (42 kDa). WB was obtained in duplicate, once with beta-Actin and once with Tubulin. (E) Western blot quantifications of VE-Cad densities normalized to actin for Cyt and Mem fractions of buff only cells (gray boxes) and TMEM OE cells (green boxes) from the representative blot shown in (D).
Acknowledgments
This image is the copyrighted work of the attributed author or publisher, and
ZFIN has permission only to display this image to its users.
Additional permissions should be obtained from the applicable author or publisher of the image.
Full text @ Cells
Your Input Welcome
Thank you for submitting comments. Your input has been emailed to ZFIN curators who may contact you if
additional information is required.
Oops. Something went wrong. Please try again later.