FIGURE SUMMARY
Title

Transmembrane Protein-184A Interacts with Syndecan-4 and Rab GTPases and Is Required to Maintain VE-Cadherin Levels

Authors
Altenburg, L.M., Wang, S.H., Ciabattoni, G.O., Kennedy, A., O'Toole, R.L., Farwell, S.L.N., Iovine, M.K., Lowe-Krentz, L.J.
Source
Full text @ Cells

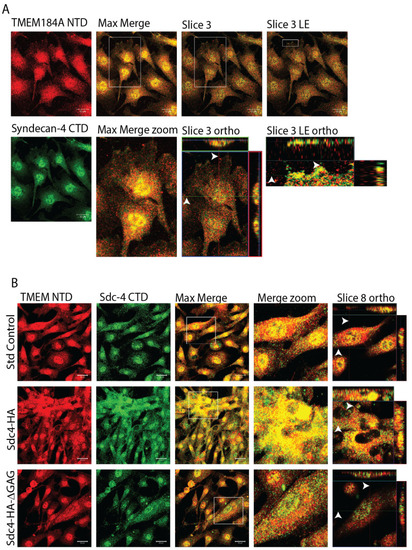
TMEM184A interacts with Sdc4 proteoglycans in BAOECs. (A) IF staining of TMEM184A NTD (red) merged with Sdc4 CTD (green) with maximum intensity (max, zoom projection) and slice 3 orthogonal (ortho) views of white boxes of slice 3 basal leading edge (LE). Z-position x and y coordinates and crosshairs correspond with white arrowheads in merged ortho images. Scale 20 μm, N = 18 across three independent experiments. (B) IF staining of lentiviral cell lines as described previously in A, with merged max intensity and slice 8 apical cell surface image projections (white boxes). Arrowheads denote x and y coordinates and crosshairs of the slice 8 z-position. Scale 20 μm. N = 6 for both Sdc4-HA and Sdc4-HA-ΔGAG transformations. N = 12 for standard control cells.

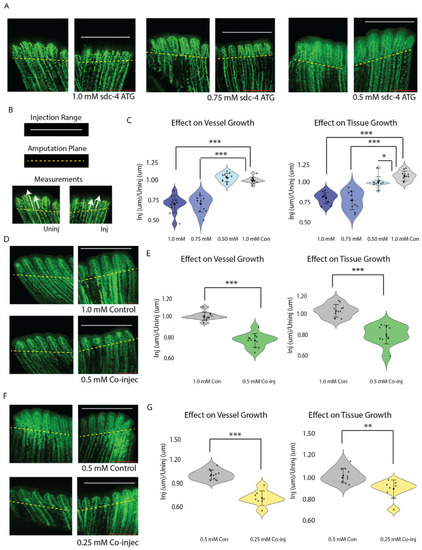
Combined subthreshold morpholinos sdc4 and tmem184a blockers synergize to produce a vascular phenotype. (A) Representative confocal images of sdc4 MO titration in Tg(fli-egfp) fin regenerants. Scale 500 μm. (B) Illustration of method showing injection range along fin rays, amputation plane demarcation, and measurements (denoted by white arrows) of vessel and tissue outgrowth comparison to generate percent difference calculations. (C) Violin plots of quantitation of sdc4 MO titration injections (blue range violins from darkest (1.0 mM) to lightest (0.5 mM)) for vessel (left) and tissue (right) outgrowth of the uninjected and injected third rays compared with Lissamine control MO (gray violin) shown in A. sdc4 blocker: n = 11 for 0.5 mM, 0.75 mM, and 1.0 mM representative groups, * p < 0.05 and *** p < 0.0005 in a student t-test. (D) Confocal images of Tg(fli-egfp) fin regenerants injected with 1.0 mM Lissamine control MO (1.0 mM Con) and combined 0.5 mM sdc4 and 0.5 mM tmem morpholinos, (0.5 mM Co-injec). Scale 500 μm. (E) Violin plots of quantitation, as in C, showing direct comparisons of vessel and tissue outgrowth for the 1.0 mM Con (gray violins) and 0.5 mM co-injec (green violins) groups of the injected and uninjected third rays from the amputation planes, n = 11 for 1.0 mM Con and 0.5 mM Co-injec representative groups, *** p < 0.0005 in a student t-test. (F) Confocal images of Tg(fli-egfp) fin regenerants injected with 0.5 mM Lissamine control MO (0.5 mM Con) and combined 0.25 mM sdc4 and 0.25 mM tmem184a ATG morpholinos, (0.25 mM Co-injec). Scale 500 μm. (G) Violin plots of quantitation, as in E, showing direct comparisons of vessel and tissue outgrowth for the 0.5 mM Con (gray violins) and 0.25 mM co-injec (yellow violins) groups of the injected and uninjected third rays from the amputation planes, n = 11 for 0.5 mM Con group and n = 8 for 0.5 mM Co-injec group, ** p < 0.005 in a student t-test, *** p < 0.0005.

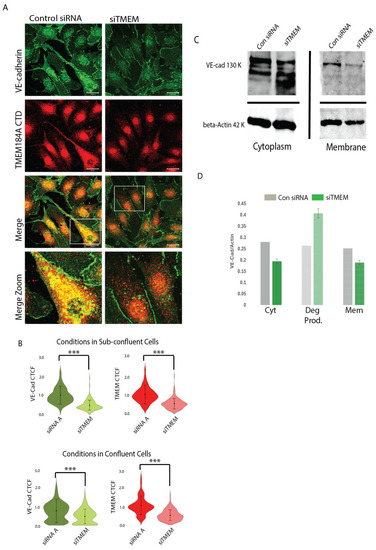
TMEM184A siRNA KD decreases post-translational levels of VE-cad in the membrane and in cytoplasmic vesicles. (A) Comparisons of VE-cad (green) and TMEM CTD staining (red) in control siRNA (Con siRNA) and siTMEM BAOECs. Reduced levels of VE-cad and TMEM are highlighted in merged, white box, zoom, comparisons. Scale 20 μm. (B) Violin plots of corrected total cell fluorescence (CTCF) values of VE-cad and TMEM184A across Con siRNA (dark green and dark red violins) and siTMEM cells (light green and light red violins) in sub-confluent and confluent BAOECs across three independent experiments, n = 179 in sub-confluent condition, n = 193 in confluent condition, *** p < 0.0001. (C) WB of Con siRNA and siTMEM subcellular fractionation lysates comparing Cyt (supernatant) and Mem (pellet) fractions. Cyt fractions show full length VE-cad (130 kDa) and Actin loading control (42 kDa) with increased degradation in the siTMEM lane. In Mem fractions, full length VE-cad and Actin loading control bands are compared in one independent experiment. (D) Quantification of WB of subcellular fractionation densities of VE-cad normalized to Actin for full length VE-cad, VE-cad degradation products, and membrane VE-cad bands from one representative blot.

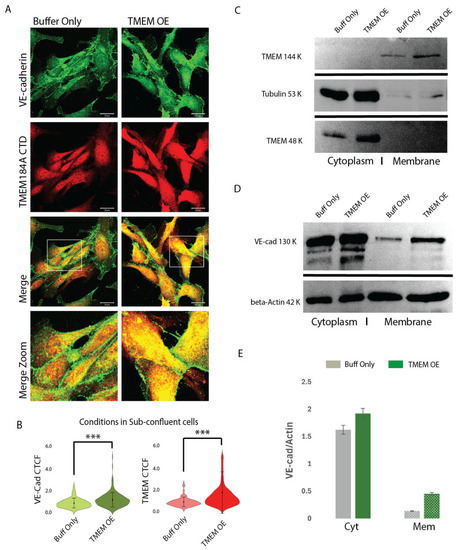
TMEM OE increases VE-cad rapid recycling and membrane levels. (A) Comparisons of VE-cad (green) and TMEM184A CTD (red) staining in mock control and TMEM OE BAOECs. Increased levels of VE-cad and TMEM and VE-cad-TMEM colocalization in TMEM OE are highlighted in merged, white box, zoom, comparisons. Scale 20 μm. (B) Violin plots of corrected total cell fluorescence (CTCF) values of VE-cad and TMEM184A across cells electroporated with buffer only (buff only, light green, and light red violins) and cells electroporated with TMEM-tGFP (TMEM OE, dark green and dark red violins) in sub-confluent BAOECs across three independent experiments, n = 198, *** p < 0.0001. (C) TMEM OE confirmation with TMEM184A CTD staining in cells electroporated with buffer only (Buff only) and cells electroporated with TMEM-tGFP showing TMEM184A CTD (144 kDa, 48 kDa) and Tubulin (53 kDa). (D) Representative WB of subcellular fractionation samples from buff only and TMEM OE cells, VE-cad (130 kDa), beta-actin (42 kDa). WB was obtained in duplicate, once with beta-Actin and once with Tubulin. (E) Western blot quantifications of VE-Cad densities normalized to actin for Cyt and Mem fractions of buff only cells (gray boxes) and TMEM OE cells (green boxes) from the representative blot shown in (D).

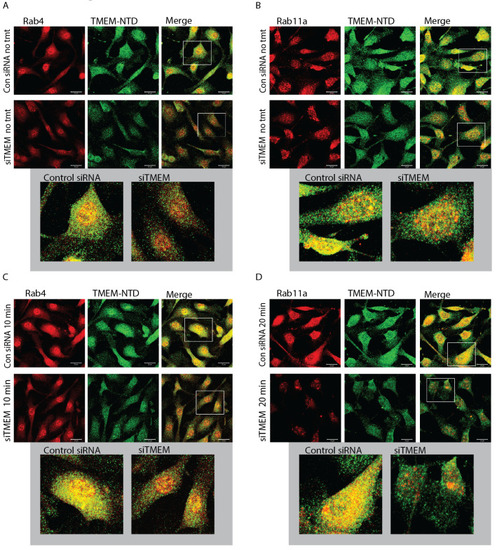
TMEM184A colocalizes with recycling Rab-GTPases in the presence of VEGF. BAOECs were treated with VEGF-165 or left untreated as noted, fixed, and permeabilized with 0.5% Triton X-100 to increase the visibility of vesicles. (A) In untreated cells (no tmt), Rab4 (red) colocalizes with TMEM184A NTD (green) in bright yellow puncta (gray box, max intensity projection zoom). Scale 20 μm. Images are representative of 19 Con siRNA images and 17 siTMEM images from four independent experiments. (B) Rab11a (red) colocalizes with TMEM184A NTD (green) in bright yellow and orange puncta (gray box, max intensity projection zoom) in cells without treatment. Scale 20 μm. Images are representative of 11 Control and KD images from two independent experiments. (C) Rab 4 (red), (D) Rab11 (red) and TMEM184A NTD (green) colocalization appears to increase (gray boxes) upon 10 and 20 min VEGF treatment. Scale 20 μm. Images are representative of 13 Con siRNA images and 11 siTMEM images from two independent experiments for C., and 11 images for Control and KD cells across two independent experiments for D.

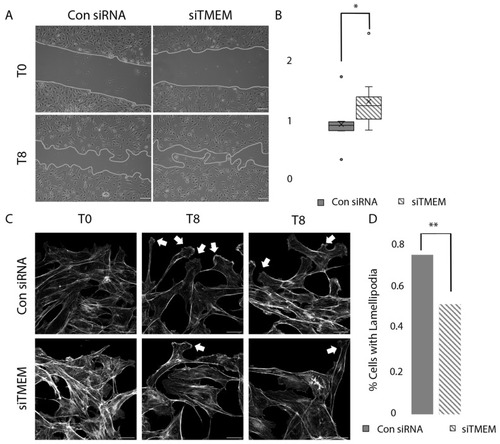
Rate of closure in siTMEM and siRNA cells. (A) Phase contrast (10×) images of transiently transfected BAOEC (siTMEM or control siRNA) cells undergoing migration 0 and 8 h post scratch. Seeded on 0.2% porcine gel; conducted in 0.2–0.5% Hi-FBS MEM media, 37 °C, and 5% CO2. The gray line indicates the leading edge of migration. Scale 100 μm. (B) Rate of closure per well (siTMEM n = 11, control siRNA n = 10) was calculated and normalized to average rate of closure for siRNA per replicate (N = 3). A Mann–Whitney U test was performed, * p < 0.05. (U = 21, p = 0.016). (C) Confocal microscopy of the leading edge at 0 and 8 h post scratch (Gray: Phalloidin) (scale 20 μm). White arrows indicate lamellipodia during cell migrating at the leading edge at T8. (D) Percentage of migratory front cells containing lamellipodia (KD n = 125, control siRNA n = 132 cells). A chi-squared test was performed ** p < 0.001.

Acknowledgments
This image is the copyrighted work of the attributed author or publisher, and ZFIN has permission only to display this image to its users. Additional permissions should be obtained from the applicable author or publisher of the image. Full text @ Cells