FIGURE

Figure 3

ID
ZDB-FIG-250612-78
Publication
Altenburg et al., 2025 - Transmembrane Protein-184A Interacts with Syndecan-4 and Rab GTPases and Is Required to Maintain VE-Cadherin Levels
Other Figures
All Figure Page
Back to All Figure Page
Figure 3

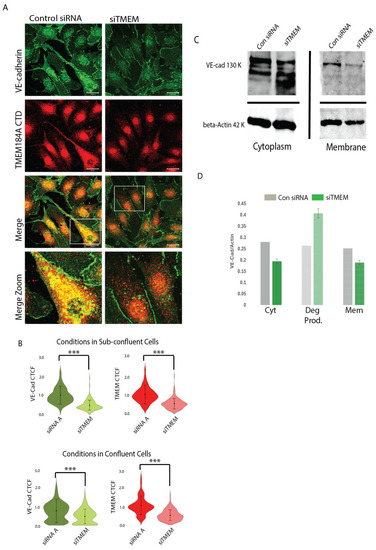
TMEM184A siRNA KD decreases post-translational levels of VE-cad in the membrane and in cytoplasmic vesicles. (A) Comparisons of VE-cad (green) and TMEM CTD staining (red) in control siRNA (Con siRNA) and siTMEM BAOECs. Reduced levels of VE-cad and TMEM are highlighted in merged, white box, zoom, comparisons. Scale 20 μm. (B) Violin plots of corrected total cell fluorescence (CTCF) values of VE-cad and TMEM184A across Con siRNA (dark green and dark red violins) and siTMEM cells (light green and light red violins) in sub-confluent and confluent BAOECs across three independent experiments, n = 179 in sub-confluent condition, n = 193 in confluent condition, *** p < 0.0001. (C) WB of Con siRNA and siTMEM subcellular fractionation lysates comparing Cyt (supernatant) and Mem (pellet) fractions. Cyt fractions show full length VE-cad (130 kDa) and Actin loading control (42 kDa) with increased degradation in the siTMEM lane. In Mem fractions, full length VE-cad and Actin loading control bands are compared in one independent experiment. (D) Quantification of WB of subcellular fractionation densities of VE-cad normalized to Actin for full length VE-cad, VE-cad degradation products, and membrane VE-cad bands from one representative blot.

Expression Data

Expression Detail
Antibody Labeling
Phenotype Data

Phenotype Detail
Acknowledgments
This image is the copyrighted work of the attributed author or publisher, and ZFIN has permission only to display this image to its users. Additional permissions should be obtained from the applicable author or publisher of the image. Full text @ Cells