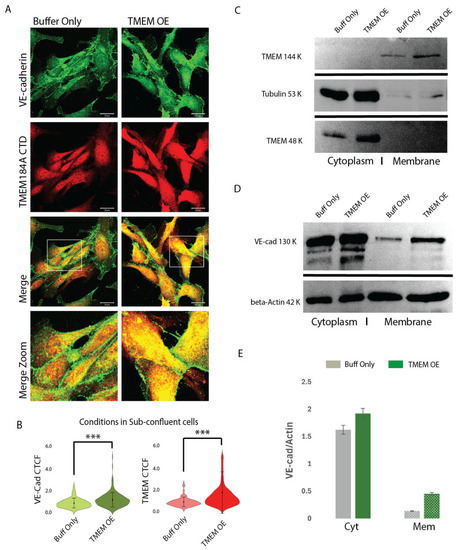
TMEM OE increases VE-cad rapid recycling and membrane levels. (A) Comparisons of VE-cad (green) and TMEM184A CTD (red) staining in mock control and TMEM OE BAOECs. Increased levels of VE-cad and TMEM and VE-cad-TMEM colocalization in TMEM OE are highlighted in merged, white box, zoom, comparisons. Scale 20 μm. (B) Violin plots of corrected total cell fluorescence (CTCF) values of VE-cad and TMEM184A across cells electroporated with buffer only (buff only, light green, and light red violins) and cells electroporated with TMEM-tGFP (TMEM OE, dark green and dark red violins) in sub-confluent BAOECs across three independent experiments, n = 198, *** p < 0.0001. (C) TMEM OE confirmation with TMEM184A CTD staining in cells electroporated with buffer only (Buff only) and cells electroporated with TMEM-tGFP showing TMEM184A CTD (144 kDa, 48 kDa) and Tubulin (53 kDa). (D) Representative WB of subcellular fractionation samples from buff only and TMEM OE cells, VE-cad (130 kDa), beta-actin (42 kDa). WB was obtained in duplicate, once with beta-Actin and once with Tubulin. (E) Western blot quantifications of VE-Cad densities normalized to actin for Cyt and Mem fractions of buff only cells (gray boxes) and TMEM OE cells (green boxes) from the representative blot shown in (D).
|
