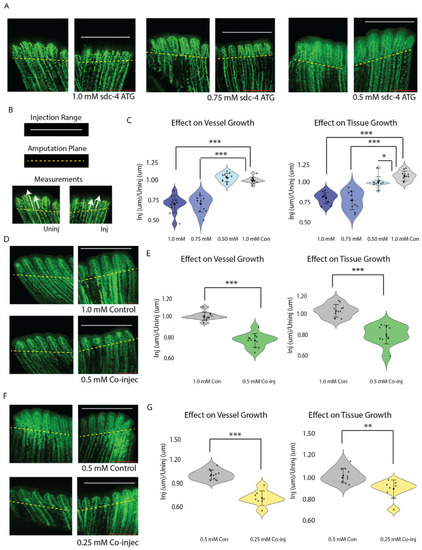
Combined subthreshold morpholinos sdc4 and tmem184a blockers synergize to produce a vascular phenotype. (A) Representative confocal images of sdc4 MO titration in Tg(fli-egfp) fin regenerants. Scale 500 μm. (B) Illustration of method showing injection range along fin rays, amputation plane demarcation, and measurements (denoted by white arrows) of vessel and tissue outgrowth comparison to generate percent difference calculations. (C) Violin plots of quantitation of sdc4 MO titration injections (blue range violins from darkest (1.0 mM) to lightest (0.5 mM)) for vessel (left) and tissue (right) outgrowth of the uninjected and injected third rays compared with Lissamine control MO (gray violin) shown in A. sdc4 blocker: n = 11 for 0.5 mM, 0.75 mM, and 1.0 mM representative groups, * p < 0.05 and *** p < 0.0005 in a student t-test. (D) Confocal images of Tg(fli-egfp) fin regenerants injected with 1.0 mM Lissamine control MO (1.0 mM Con) and combined 0.5 mM sdc4 and 0.5 mM tmem morpholinos, (0.5 mM Co-injec). Scale 500 μm. (E) Violin plots of quantitation, as in C, showing direct comparisons of vessel and tissue outgrowth for the 1.0 mM Con (gray violins) and 0.5 mM co-injec (green violins) groups of the injected and uninjected third rays from the amputation planes, n = 11 for 1.0 mM Con and 0.5 mM Co-injec representative groups, *** p < 0.0005 in a student t-test. (F) Confocal images of Tg(fli-egfp) fin regenerants injected with 0.5 mM Lissamine control MO (0.5 mM Con) and combined 0.25 mM sdc4 and 0.25 mM tmem184a ATG morpholinos, (0.25 mM Co-injec). Scale 500 μm. (G) Violin plots of quantitation, as in E, showing direct comparisons of vessel and tissue outgrowth for the 0.5 mM Con (gray violins) and 0.25 mM co-injec (yellow violins) groups of the injected and uninjected third rays from the amputation planes, n = 11 for 0.5 mM Con group and n = 8 for 0.5 mM Co-injec group, ** p < 0.005 in a student t-test, *** p < 0.0005.
|
