IMAGE

Fig. 2.

ID
ZDB-IMAGE-250710-73
Source
Figures for Dang et al., 2025
Image
Figure Caption

Fig. 2.

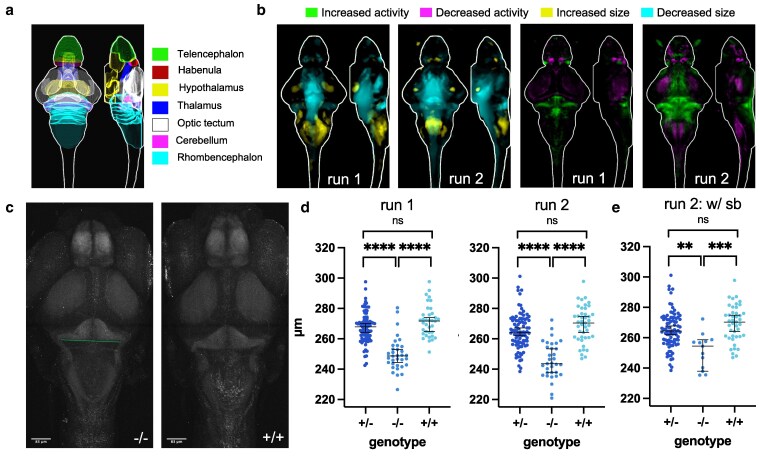
Brain structure and activity phenotypes of zebrafish ebf3a mutants. a) Schematic of major zebrafish brain regions based on the Z-Brain atlas (Randlett et al. 2015). b) Brain structure and activity maps for 2 runs from separate clutches, comparing homozygous mutants (−/−) to WT (+/+) siblings. A sum-of-slices intensity projection is shown (Z- and X- axes) of the signals inside the brain (white outline). Run 1 N = 34 homozygotes (−/−) compared with 36 wild types (+/+); Run 2 N = 36 homozygotes (−/−) compared with 46 wild types (+/+). c) Example of measuring the width of the hindbrain in the cerebellum region on the raw confocal stacks. The line represents the measurement that was made on maximum-intensity projections of the tErk stain. d) Measurement of the hindbrain width in all animals from the 2 runs. The P-values for both runs are <0.0001 for comparisons of homozygous mutants (−/−) to both WT (+/+) and heterozygous (+/−) siblings. P-values were calculated using the Brown-Forsythe and Welch ANOVA with Dunnett's T3 multiple comparisons test (GraphPad Prism 10). e) Measurement of the hindbrain width for only those with swim bladders from run 2. The P-values are 0.0002 for homozygous mutants (−/−) compared with WT (+/+) and 0.0024 for homozygotes (−/−) compared with heterozygotes (+/−).

Acknowledgments
This image is the copyrighted work of the attributed author or publisher, and ZFIN has permission only to display this image to its users. Additional permissions should be obtained from the applicable author or publisher of the image. Full text @ G3 (Bethesda)