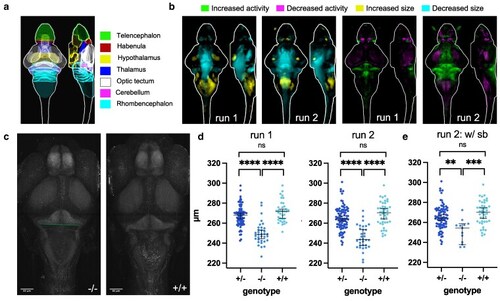
Brain structure and activity phenotypes of zebrafish ebf3a mutants. a) Schematic of major zebrafish brain regions based on the Z-Brain atlas (Randlett et al. 2015). b) Brain structure and activity maps for 2 runs from separate clutches, comparing homozygous mutants (−/−) to WT (+/+) siblings. A sum-of-slices intensity projection is shown (Z- and X- axes) of the signals inside the brain (white outline). Run 1 N = 34 homozygotes (−/−) compared with 36 wild types (+/+); Run 2 N = 36 homozygotes (−/−) compared with 46 wild types (+/+). c) Example of measuring the width of the hindbrain in the cerebellum region on the raw confocal stacks. The line represents the measurement that was made on maximum-intensity projections of the tErk stain. d) Measurement of the hindbrain width in all animals from the 2 runs. The P-values for both runs are <0.0001 for comparisons of homozygous mutants (−/−) to both WT (+/+) and heterozygous (+/−) siblings. P-values were calculated using the Brown-Forsythe and Welch ANOVA with Dunnett's T3 multiple comparisons test (GraphPad Prism 10). e) Measurement of the hindbrain width for only those with swim bladders from run 2. The P-values are 0.0002 for homozygous mutants (−/−) compared with WT (+/+) and 0.0024 for homozygotes (−/−) compared with heterozygotes (+/−).
|
