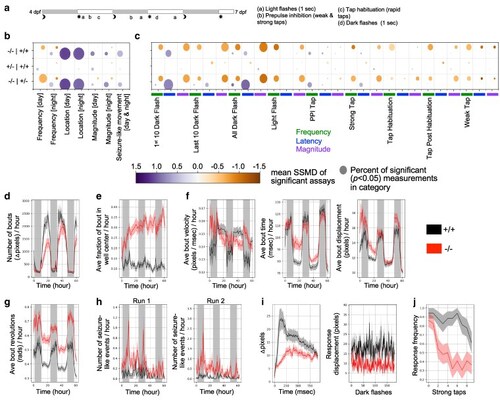
Behavioral phenotypes of zebrafish ebf3a mutants. a) Multiday behavioral pipeline with acoustic and visual stimulation. b) Summary visualization of baseline behavioral phenotypes in ebf3a homozygous mutants (−/−) compared with respective siblings. The size of the bubble represents the percent of significant measurements in the summarized category, and the color represents the mean of the SSMD of the significant assays in that category. Run 1 N = 23 homozygotes (−/−), 18 wild types (+/+), and 36 heterozygotes (+/+). c) Summary visualization of stimulus-driven behavioral phenotypes in ebf3a homozygous mutants compared with respective siblings. d) Example of a frequency of movement phenotype, shown for the entire duration of the experiment. This measure is the number of bouts, binned per hour, calculated using the change in pixels between each frame (linear mixed model P-value = 0.005). e) Example of a location preference plot, shown for the direction of the experiment. This measure is the fraction of the frames of a bout that is spent in the center zone of the well, binned per hour, calculated based on the centroid positions of the fish (P-value = 0.001). f) Examples of bout magnitude measures, shown for the duration of the experiment, binned per hour, and calculated based on the centroid positions of the fish. The bout velocity is not significant when considering the experiment duration, but subregions do have significant P-values (e.g. the third night or day3nightall, binned per 10-min, P-value = 0.001). Bout time P-value for the experiment duration = 0.025, and bout displacement = 0.001. g) Bout revolutions for the duration of the experiment (P-value = 0.001). h) Movements that resemble seizures (P-value = 0.001 for both sets). These are calculated based on the movement including more than 4 full revolutions, moving a distance of over 70 pixels, and having a speed of 0.3–1.3 pixels/msec. i) Displacement for the dark flash response movement (right). Kruskal–Wallis ANOVA P-value = 1.7e−06. The response graph (right) is the average movement (pixel-based) of larvae in the homozygous mutant and WT control groups for events where a response was observed. j) Frequency of responses to strong taps. The block shown is the strong taps completed prior to the first habituation block at 5 dpf (day5dpfhab1pre), with Kruskal–Wallis ANOVA P-value = 9.2e−05. Plots of homozygous mutant (−/−) compared with WT (+/+) control groups in panels (d–j) are mean ± SEM.
|

