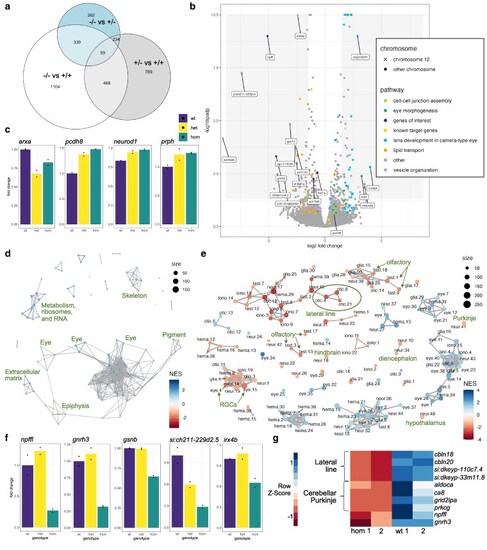
Transcriptional changes in zebrafish ebf3a mutants. a) Venn diagram of shared DEGs between the genotype comparisons of 2 dpf RNA-Sequencing data. The DEGs were filtered using a P-value of <0.05 and log2 fold change of >0.2. b) Volcano plot of the 2 dpf RNA-Sequencing data for the comparison of homozygous mutants vs combined heterozygous and WT larvae. Genes involved in pathways identified by GO analysis are identified. Genes with log2 fold changes of >1.0 and adjusted P-values of <0.01 are labeled, as are several additional genes of interest. c) Normalized counts data for WT, heterozygous, and homozygous samples for genes selected based on known involvement with ebf3. d) Network plot of all GSEA C5 molecular signatures for the comparison of 2 dpf homozygous mutants vs combined heterozygous and WT larvae, with general groupings labeled. e) GSEA network plot with single-cell types from the Daniocell larval zebrafish atlas. Clusters of particular interest are labeled with arrows and a circle to designate the clusters corresponding to the lateral line. f) Normalized counts data for WT, heterozygous, and homozygous samples for genes with strong downregulation in ebf3a mutants and mark specific neuron types. g). Genes that are downregulated in 5 dpf RNA-Sequencing data and mark specific neuron types. All analysis code, additional results, terms and genes found by the GO and GSEA analyses, and necessary files for the panels of this figure are available in Supplementary Data 1 in the Zenodo repository.
|
