FIGURE SUMMARY
Title

Disrupted development of sensory systems and the cerebellum in a zebrafish ebf3a mutant

Authors
Dang, N.D.P., Barcus, A.K., Conklin, C.L., Truong, T.Q., Vivian, M.D., Wang, J., Thomas, H.R., Parant, J.M., Yeo, N.C., Thyme, S.B.
Source
Full text @ G3 (Bethesda)

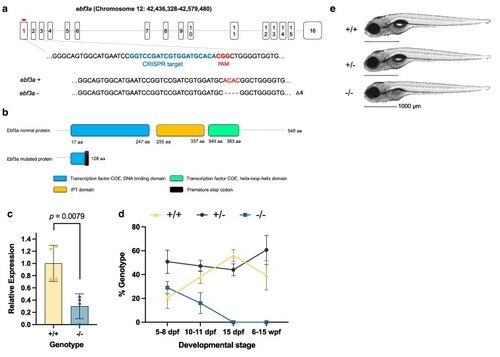
Generation and developmental characterization of zebrafish ebf3a mutants. a) Schematic of zebrafish ebf3a gene transcript and CRISPR gRNA targeting sequence. b) Schematic of zebrafish WT and mutant Ebf3a proteins. Domains are annotated based on ensemble Pfam database. c) Expression level of ebf3a in WT (+/+) and homozygous mutant (−/−) animals at 5 dpf, normalized to the WT level. d) Survival of ebf3a homozygous mutants (−/−) and respective siblings over larval development. e) Representative photos of ebf3a homozygous mutants (−/−) and respective siblings at 5 dpf.

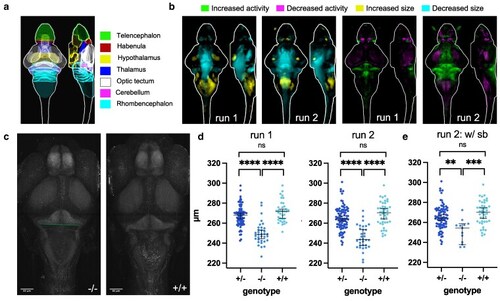
Brain structure and activity phenotypes of zebrafish ebf3a mutants. a) Schematic of major zebrafish brain regions based on the Z-Brain atlas (Randlett et al. 2015). b) Brain structure and activity maps for 2 runs from separate clutches, comparing homozygous mutants (−/−) to WT (+/+) siblings. A sum-of-slices intensity projection is shown (Z- and X- axes) of the signals inside the brain (white outline). Run 1 N = 34 homozygotes (−/−) compared with 36 wild types (+/+); Run 2 N = 36 homozygotes (−/−) compared with 46 wild types (+/+). c) Example of measuring the width of the hindbrain in the cerebellum region on the raw confocal stacks. The line represents the measurement that was made on maximum-intensity projections of the tErk stain. d) Measurement of the hindbrain width in all animals from the 2 runs. The P-values for both runs are <0.0001 for comparisons of homozygous mutants (−/−) to both WT (+/+) and heterozygous (+/−) siblings. P-values were calculated using the Brown-Forsythe and Welch ANOVA with Dunnett's T3 multiple comparisons test (GraphPad Prism 10). e) Measurement of the hindbrain width for only those with swim bladders from run 2. The P-values are 0.0002 for homozygous mutants (−/−) compared with WT (+/+) and 0.0024 for homozygotes (−/−) compared with heterozygotes (+/−).

Behavioral phenotypes of zebrafish ebf3a mutants. a) Multiday behavioral pipeline with acoustic and visual stimulation. b) Summary visualization of baseline behavioral phenotypes in ebf3a homozygous mutants (−/−) compared with respective siblings. The size of the bubble represents the percent of significant measurements in the summarized category, and the color represents the mean of the SSMD of the significant assays in that category. Run 1 N = 23 homozygotes (−/−), 18 wild types (+/+), and 36 heterozygotes (+/+). c) Summary visualization of stimulus-driven behavioral phenotypes in ebf3a homozygous mutants compared with respective siblings. d) Example of a frequency of movement phenotype, shown for the entire duration of the experiment. This measure is the number of bouts, binned per hour, calculated using the change in pixels between each frame (linear mixed model P-value = 0.005). e) Example of a location preference plot, shown for the direction of the experiment. This measure is the fraction of the frames of a bout that is spent in the center zone of the well, binned per hour, calculated based on the centroid positions of the fish (P-value = 0.001). f) Examples of bout magnitude measures, shown for the duration of the experiment, binned per hour, and calculated based on the centroid positions of the fish. The bout velocity is not significant when considering the experiment duration, but subregions do have significant P-values (e.g. the third night or day3nightall, binned per 10-min, P-value = 0.001). Bout time P-value for the experiment duration = 0.025, and bout displacement = 0.001. g) Bout revolutions for the duration of the experiment (P-value = 0.001). h) Movements that resemble seizures (P-value = 0.001 for both sets). These are calculated based on the movement including more than 4 full revolutions, moving a distance of over 70 pixels, and having a speed of 0.3–1.3 pixels/msec. i) Displacement for the dark flash response movement (right). Kruskal–Wallis ANOVA P-value = 1.7e−06. The response graph (right) is the average movement (pixel-based) of larvae in the homozygous mutant and WT control groups for events where a response was observed. j) Frequency of responses to strong taps. The block shown is the strong taps completed prior to the first habituation block at 5 dpf (day5dpfhab1pre), with Kruskal–Wallis ANOVA P-value = 9.2e−05. Plots of homozygous mutant (−/−) compared with WT (+/+) control groups in panels (d–j) are mean ± SEM.

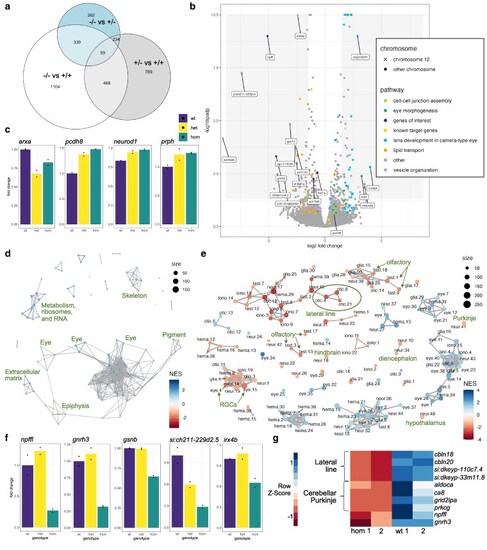
Transcriptional changes in zebrafish ebf3a mutants. a) Venn diagram of shared DEGs between the genotype comparisons of 2 dpf RNA-Sequencing data. The DEGs were filtered using a P-value of <0.05 and log2 fold change of >0.2. b) Volcano plot of the 2 dpf RNA-Sequencing data for the comparison of homozygous mutants vs combined heterozygous and WT larvae. Genes involved in pathways identified by GO analysis are identified. Genes with log2 fold changes of >1.0 and adjusted P-values of <0.01 are labeled, as are several additional genes of interest. c) Normalized counts data for WT, heterozygous, and homozygous samples for genes selected based on known involvement with ebf3. d) Network plot of all GSEA C5 molecular signatures for the comparison of 2 dpf homozygous mutants vs combined heterozygous and WT larvae, with general groupings labeled. e) GSEA network plot with single-cell types from the Daniocell larval zebrafish atlas. Clusters of particular interest are labeled with arrows and a circle to designate the clusters corresponding to the lateral line. f) Normalized counts data for WT, heterozygous, and homozygous samples for genes with strong downregulation in ebf3a mutants and mark specific neuron types. g). Genes that are downregulated in 5 dpf RNA-Sequencing data and mark specific neuron types. All analysis code, additional results, terms and genes found by the GO and GSEA analyses, and necessary files for the panels of this figure are available in Supplementary Data 1 in the Zenodo repository.

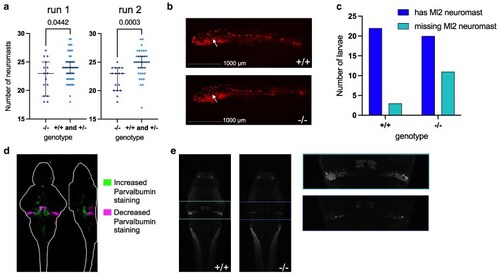
Staining of the lateral line and Purkinje neurons in zebrafish ebf3a mutants. a) Counts for lateral line neuromasts on one side of the 6 dpf zebrafish. Run 1 N = 15 −/− and 50 +/− and +/+; Run 2 N = 16 −/− and 36 +/− and +/+. Significance was assessed using an unpaired t-test. b) Representative image of lateral line staining. The white arrow indicates the MI2 neuromast which was absent in some homozygous mutant larvae. c) Combined quantification of missing MI2 neuromasts from both runs. Only homozygous mutants and WT siblings were included. One-sided Chi-square test: P = 0.0218. d) Brain map of the quantified differences in Parvalbumin staining, comparing homozygous mutants (−/−) to WT (+/+) siblings. A sum-of-slices intensity projection is shown (Z- and X- axes) of the signals inside the brain (white outline). N = 14 homozygotes (−/−) compared with 26 wild types (+/+). e) Example slice of Parvalbumin staining from registered stacks. The slice is at position 100 out of 138 in the standard Z-Brain stack. The cerebellum region is boxed and shown enlarged to the right.

Acknowledgments
This image is the copyrighted work of the attributed author or publisher, and ZFIN has permission only to display this image to its users. Additional permissions should be obtained from the applicable author or publisher of the image. Full text @ G3 (Bethesda)