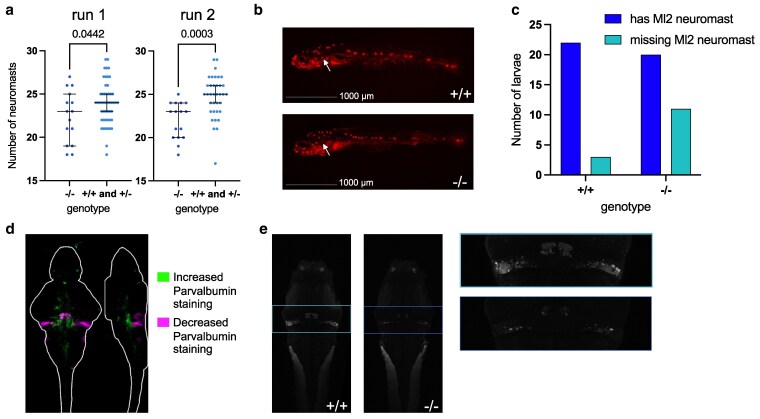
Staining of the lateral line and Purkinje neurons in zebrafish ebf3a mutants. a) Counts for lateral line neuromasts on one side of the 6 dpf zebrafish. Run 1 N = 15 −/− and 50 +/− and +/+; Run 2 N = 16 −/− and 36 +/− and +/+. Significance was assessed using an unpaired t-test. b) Representative image of lateral line staining. The white arrow indicates the MI2 neuromast which was absent in some homozygous mutant larvae. c) Combined quantification of missing MI2 neuromasts from both runs. Only homozygous mutants and WT siblings were included. One-sided Chi-square test: P = 0.0218. d) Brain map of the quantified differences in Parvalbumin staining, comparing homozygous mutants (−/−) to WT (+/+) siblings. A sum-of-slices intensity projection is shown (Z- and X- axes) of the signals inside the brain (white outline). N = 14 homozygotes (−/−) compared with 26 wild types (+/+). e) Example slice of Parvalbumin staining from registered stacks. The slice is at position 100 out of 138 in the standard Z-Brain stack. The cerebellum region is boxed and shown enlarged to the right.
Acknowledgments
This image is the copyrighted work of the attributed author or publisher, and
ZFIN has permission only to display this image to its users.
Additional permissions should be obtained from the applicable author or publisher of the image.
Full text @ G3 (Bethesda)
Your Input Welcome
Thank you for submitting comments. Your input has been emailed to ZFIN curators who may contact you if
additional information is required.
Oops. Something went wrong. Please try again later.