IMAGE

FIGURE 4

ID
ZDB-IMAGE-250916-9
Source
Figures for Park et al., 2025
Image
Figure Caption

FIGURE 4

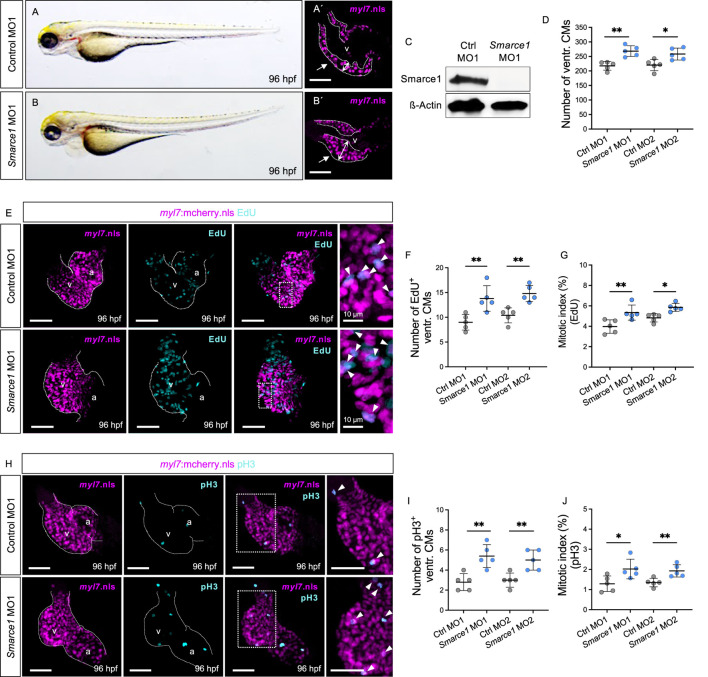
Knockdown of zebrafish smarce1 phenocopies hos cardiac hyperplasia. (A,B) Lateral views of control morpholino (MO; ctrl MO1) or smarce1 start MO (smarce1 MO1)-injected embryo at 96 hpf. Knockdown of smarce1 phenocopies the hos mutant phenotype, whereas the injection of specific control MO does not. (A′,B′) Dissected hearts from Tg (myl7:mcherry.nls) embryos after control or smarce1 MO1 injection (scale bar: 50 µm). Smarce1 knockdown results in a thickened ventricular wall of developing zebrafish heart at 96 hpf. (C) Smarce1 protein is absent in smarce1 MO1-injected embryos at 96 hpf. (D) Quantitative analyses of ventricular CM numbers show a significant increase in the hearts of smarce1 MO1- or MO2-injected embryos at 96 hpf (n = 5). (E) Confocal images of dissected hearts from control- or smarce1 MO1-injected embryos with EdU incorporation displaying CM nucleus (mCherry) and proliferating CMs (cyan) at 96 hpf (scale bar: 50 µm). (F,G) Numbers of EdU+ CMs and the mitotic index are significantly enhanced in smarce1 MO-injected embryonic ventricles compared to control (ctrl) MO-injected hearts at 96 hpf (n = 5). (H) IF images of smarce1 morphant (MO1) heart with pH3 staining displaying CM nucleus (mCherry) and proliferating CMs (cyan) at 96 hpf (scale bar: 50 µm). (I,J) Statistical assessment of counting pH3+ ventricular CMs and the mitotic index in wt and hos at 96 hpf after the injection of specific control MO1/2 or smarce1 MO1/2 reveals increased proliferation in zebrafish embryonic ventricles by the knockdown of smarce1(n = 5). v, ventricle; a, atrium; ventr., ventricular.

Acknowledgments
This image is the copyrighted work of the attributed author or publisher, and ZFIN has permission only to display this image to its users. Additional permissions should be obtained from the applicable author or publisher of the image. Full text @ Front Cell Dev Biol