
- Title
-
Knockout of rbm24a and rbm24b genes in zebrafish impairs skeletal and cardiac muscle integrity and function during development
- Authors
- Saquet, A., Ying, Z., Shi, D.L., Grifone, R.
- Source
- Full text @ Dev. Dyn.
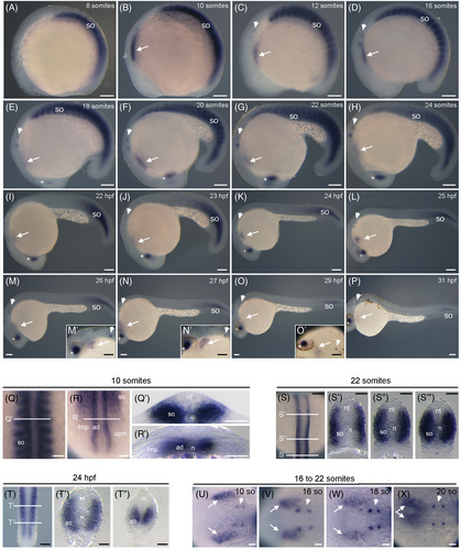
Spatio-temporal expression of rbm24a transcripts during zebrafish development. (A–P) Lateral views, with anterior to the left, showing rbm24a expression in the developing somites from 8- to 24-somite stages (A–H) and progressively restricted to most caudal somites from 22 hpf to 31 hpf (I–P). (M′—O′) Higher magnifications of the anterior region. (Q, R) Dorsal views, with anterior to the top, of the embryo at 10-somite stage shown in B, at the level of the anterior and posterior re-gions, respectively. (Q', R') Transverse sections at the levels indicated in Q and R, respectively. Note that rbm24a is expressed in the entire somite and in adaxial cells of the presomitic mesoderm. (S) Dorsal view, with anterior to the top, of the embryo at 22-somite stage shown in G, focused on the posterior region. (S′–S″′) Transverse sections at the level indicated in S. (T) Dorsal view, with anterior to the top, of the embryo at 24 hpf shown in K, focused on the most posterior region. (T′, T″) Transverse sections at the level indicated in T. (U–X) Dorsal views, with anterior to the right, of embryos presented in B–G, at the level of the heart area. The expression of rbm24a is also present in the developing heart (white arrows), otic placode (arrowheads), and lens (asterisks). So, somite; nt, neural tube; n, notochord; ad, adaxial cells; fmp, fast muscle progenitors; upm, unsegmented presomitic mesoderm. Scale bars: 100 μm. EXPRESSION / LABELING:
|
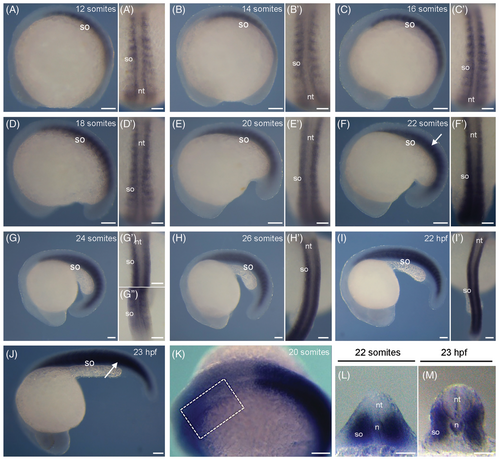
Spatio-temporal expression of rbm24b transcripts during zebrafish development. (A–K) Lateral views, with anterior to the left, of whole-mount embryos from 10-somite stage to 24 hpf, showing rbm24b expression in the developing somites. (A′–I′) Dorsal views, with anterior to the top, of embryos shown in A-I, focused on the developing somites. (K) Weak rbm24b hybridization signal (outlined by dashed rectangle) can be observed in the heart area with prolonged incubation period for chromogenic reaction. (L) Transverse section of the embryo at 20-somite stage shown in F, at the level of somite (white arrow). (M) Transverse section of the embryo at 23 hpf shown in J, at the level of the somite (white arrow). So, somite; nt, neural tube; n, notochord. Scale bars: (A–K) 100 μm; (A′—I′, L, M) 50 μm. EXPRESSION / LABELING:
|
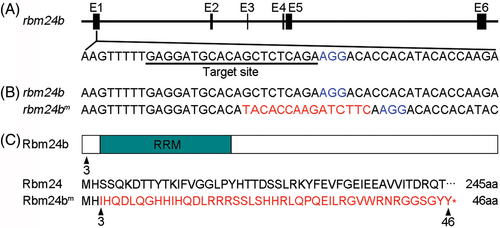
CRISPR/Cas9-mediated genome editing of the rbm24b locus. (A) The genomic organization of rbm24b locus. The guide RNA targeting sequence in the first exon (E1) is underlined, and the PAM sequence is shown in blue. (B) Deletion of eight nucleotides and insertion of 15 nucleotides (red) in the targeted region. (C) Schema of Rbm24b protein domains and alignment of amino acids between wild-type and mutated Rbm24b proteins.The triangles indicate the position where amino acid change occurs or the last amino acid in the mutated Rbm24b protein. |

Phenotype of rbm24b mutants at different stages. No morphological defects can be observed from blastula to 72 hpf. PHENOTYPE:
|

Phenotypes of rbm24a and rbm24b mutants during early development. (A, D, G, J, M) Lateral views of wild-type embryos at indicated stages. (B, E, H, K, N) Lateral views of homozygous rbm24a single mutants show heart edema (arrows) at indicated stages. (C, F, I, L, O) Lateral views of double homozygous rbm24a and rbm24b mutants show an exacerbated heart edema (arrows) at different stages. At each developmental stage, 15 to 20 embryos per genotype were analyzed. Scale bars: 250 μm. |

Disrupted integrity and function of skeletal muscles in rbm24a and rbm24b mutants. (A–C″) Lateral views, anterior to the left, showing the muscle tissue. Scale bar: 250 μm. (D) Graph representing the average normalized area of skeletal muscle pixel intensities (mean gray values) shows the reduction of trunk muscle tissues in single and double mutants. At each developmental stage, 15 to 20 embryos per genotype were analyzed. (E–F″) Lateral views comparing myofiber organization in rbm24a single mutants and rbm24a−/−;rbm24b−/− double mutants. Scale bars: 25 μm. (G, G') Representative TEM images of skeletal muscle sections at 3 dpf show that the dark A-band and the light I-band patterning is severely disrupted by accumulation of disordered sarcoplasmic reticulum (black arrow) in double mutants (n = 4). Scale bars: 1 μm. (H) Graph comparing the velocity of rbm24a single mutants and rbm24a−/−;rbm24b−/− double mutants at 2, 3 and 4 dpf. Average velocity with standard error was plotted and significant deviation was determined using the Student's t test. At each developmental stage, 15 to 20 embryos per genotype were analyzed |
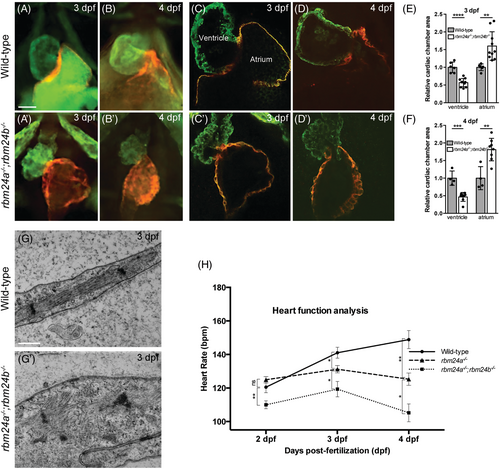
Disrupted integrity and function of cardiac muscles in rbm24a and rbm24b mutants. (A–D′) Immunofluorescence staining of ventricle and atrium in wild-type embryos and rbm24a−/−;rbm24b−/− double mutants. At each developmental stage, 15 to 20 embryos per genotype were analyzed. Scale bars: 5 μm. (E, F) Graphs measuring the ventricle and atrium size at 3 and 4 dpf, respectively. (G, G′) TEM images of heart sections. Wild-type embryos show highly organized sarcomeres with thin and thick myofilaments in well-aligned bundles and discernible dark A-band and light I-bands, while double mutant embryos display a complete disorganization of sarcomeric unit. At each developmental stage, 15 to 20 embryos per genotype were analyzed. Scale bars: 500 nm. (H) Graph comparing heart rate of rbm24a single mutants and rbm24a−/−;rbm24b−/− double mutants at 2, 3, and 4 dpf. Average heart rate with standard error was plotted and significant deviation was determined using the Student's t test. At each developmental stage, 15 to 20 embryos per genotype were analyzed. |
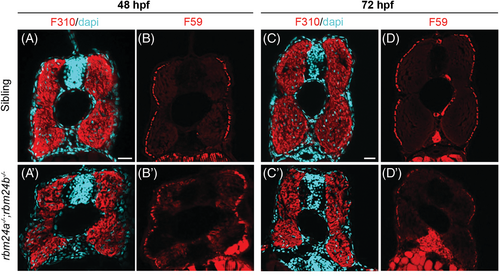
Loss of rbm24a and rbm24b affects fast and slow muscle integrity. (A–D) Wild-type embryos at 2 and 3 dpf stained with fast muscle (F310) and slow muscle (F59) antibodies. (A′–D′) Reduced and disorganized fast and slow muscles in rbm24a and rbm24b double mutant embryos (n = 4). Scale bars: 25 μm. PHENOTYPE:
|
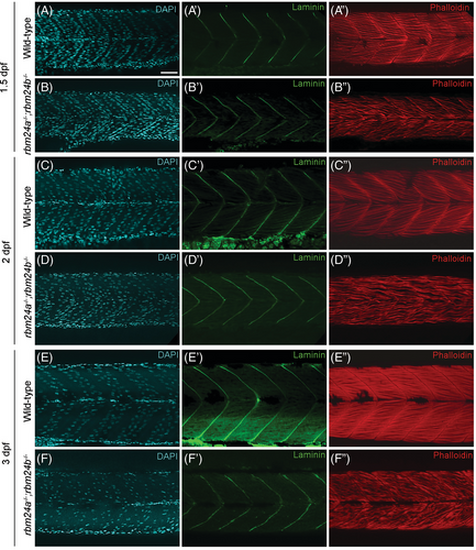
Formation of myotendinous junction in rbm24a and rbm24b mutants. (A–F) DAPI staining. (A′–F′) Laminin immunofluorescence staining. (A″–F″) Phalloidin staining. Lateral view for all embryos, with anterior to the right. Notice that myofibers appear dispersed and disorganized in rbm24a and rbm24b mutant embryos, whereas the myotendinous junction of somite boundaries exhibit a pattern similar to wild-type embryos. At each developmental stage, 15 to 20 embryos per genotype were analyzed. Scale bar: 25 μm. PHENOTYPE:
|
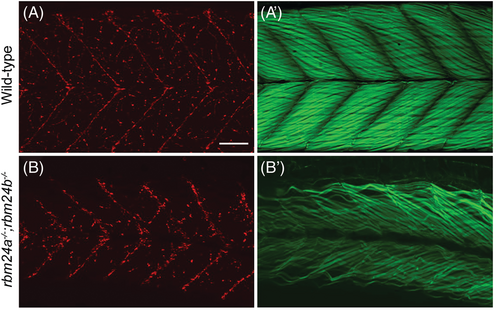
Formation of neuromuscular junctions in rbm24a and rbm24b mutants. (A, B) Alpha-bungarotoxin staining. (A′, B′) Phalloidin staining. Lateral view of wild-type and rbm24a−/−;rbm24b−/− mutant embryos at 4 dpf. Notice that myofibers appear dispersed and disorganized in rbm24a and rbm24b mutant embryos, whereas neuromuscular jonctions are present and are arborized in a smilar pattern as those vizualized in the wild-type. Scale bar: 50 μm. PHENOTYPE:
|