
- Title
-
Expression analysis of genes including Zfhx4 in mice and zebrafish reveals a temporospatial conserved molecular basis underlying craniofacial development
- Authors
- Liu, S., Xu, L., Kashima, M., Narumi, R., Takahata, Y., Nakamura, E., Shibuya, H., Tamura, M., Shida, Y., Inubushi, T., Nukada, Y., Miyazawa, M., Hata, K., Nishimura, R., Yamashiro, T., Tasaki, J., Kurosaka, H.
- Source
- Full text @ Dev. Dyn.
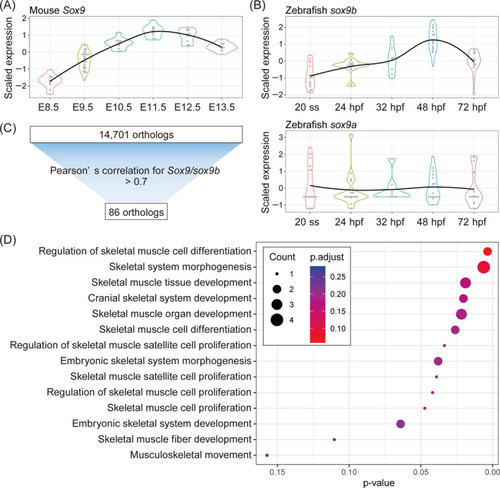
Screening of genes with similar trajectories between mice and zebrafish during craniofacial development. (A,B) Violin plots of scaled log2 normalized gene expression of |
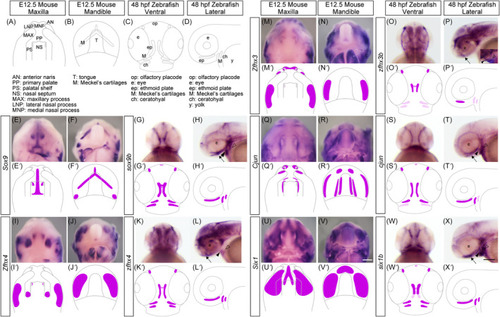
Comparing the expression pattern of the selected genes during craniofacial morphogenesis in mouse and zebrafish embryos. (A–D) Schematic illustrations of the craniofacial anatomy of the maxillary (A) and mandibular (B) regions of mice at E12.5 and zebrafish at 48 hours postfertilization (hpf) (C,D). (E–X) The expression pattern of EXPRESSION / LABELING:
|
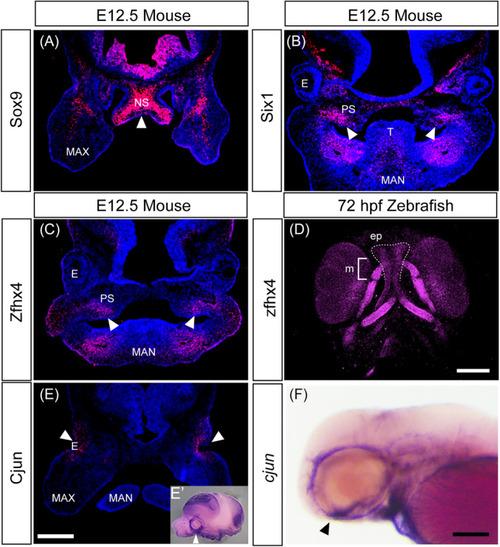
Protein localization in the developing head of mice and zebrafish. (A–D) Immunohistochemistry of selected transcription factors involved in chondrogenesis and osteogenesis using frontal sections of E12.5 mice head (A–C) and ventral view of 72 hours postfertilization (hpf) zebrafish larva (D). Samples are shown at the top, and proteins are shown on the left. White arrows indicate the protein detected in the nasal septum (A) and palate (B,C). (D) Immunofluorescence staining with anti‐ EXPRESSION / LABELING:
|
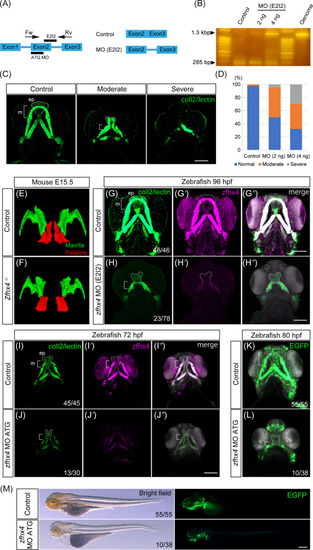
Morpholino (MO)‐based EXPRESSION / LABELING:
PHENOTYPE:
|
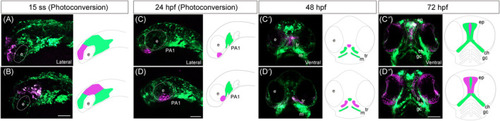
Lineage tracing of cranial neural crest cells (CNCCs) in EXPRESSION / LABELING:
|

EXPRESSION / LABELING:
PHENOTYPE:
|