
- Title
-
Development of Zebrafish model for Iron Induced Neuroinflammation
- Authors
- Bagwe Parab, S., Kaur, G.
- Source
- Full text @ Fish Physiol. Biochem.
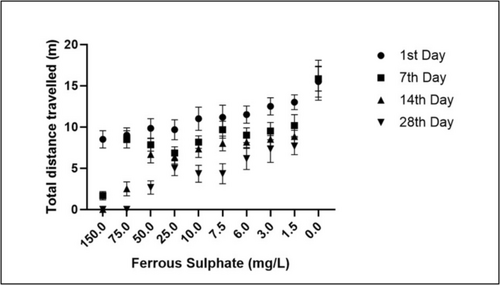
Dose optimization studies for finding out the appropriate concentration of the ferrous Sulphate induction |

Ferrous Sulphate (1.5, 3, and 6 mg/L) impaired the locomotion pattern and memory in the Y maze test (A) Illustration of representative locomotion tracking pattern of the Control group and FeSO4 (1.5, 3, and 6 mg/L) treated groups. Here, 1: Start Arm; 2: Other Arm and; 3: Novel Arm (B) Graphical representation of the total distance travelled in different groups. (C) Graphical representation of the No. of entries of the zebrafish in each arm (Normal arm (start arm), Other arm and Novel arm. Data are represented as means ± S.E.M. (n = 10). For Bonferroni’s post hoc analyses: (B) Control vs. Fe1(1.5 mg/L): ** p < 0.001, Control vs. Fe2(3 mg/L): *** p < 0.0001, Control vs. Fe3(6 mg/L): *** p < 0.0001. (C) For Novel arm: Control vs. Fe1(1.5 mg/L): *** p < 0.0001, Control vs. Fe2(3 mg/L): *** p < 0.0001, Control vs. Fe3(6 mg/L): *** p < 0.0001. (D) Control vs. Fe1(1.5 mg/L): *** p < 0.0001, Control vs. Fe2(3 mg/L): *** p < 0.0001, Control vs. Fe3(6 mg/L): *** p < 0.0001 PHENOTYPE:
|

Ferrous Sulphate (1.5, 3, and 6 mg/L) impaired the locomotion and increased the anxiety levels in the zebrafish when subjected to novel tank test (A) Illustration of representative locomotion tracking pattern (Novel tank test) of the Control group and FeSO4 (1.5, 3, and 6 mg/L) treated groups. (B) Graphical representation of the total time spent by the zebrafish in the top zone of the novel tank. (C) Graphical representation of the Ratio of time spent in the Top/Bottom zone in the different groups. Data are represented as means ± S.E.M. (n = 10). For Bonferroni’s post hoc analyses: (B) Control vs. Fe1(1.5 mg/L): *** p < 0.0001, Control vs. Fe2(3 mg/L): *** p < 0.0001, Control vs. Fe3(6 mg/L): *** p < 0.0001. (C) Control vs. Fe1(1.5 mg/L): *** p < 0.0001, Control vs. Fe2(3 mg/L): *** p < 0.0001, Control vs. Fe3(6 mg/L): *** p < 0.0001 PHENOTYPE:
|
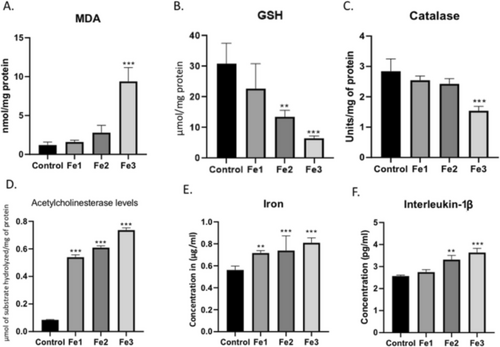
Ferrous Sulphate (1.5, 3, and 6 mg/L) disrupted the antioxidant mechanism in zebrafish and increased the levels of Acetylcholine esterase, Iron and Interleukin-1β in the zebrafish brain. (A-C) Graphical representation of the enzymes specific activity to estimate the oxidative stress in the zebrafish brain. (D) Graphical representation of the levels of Acetylcholinesterase in the zebrafish brain. (E) Graphical representation of the levels of tissue bounded iron levels in the brain of the zebrafish. (F) Graphical representation of the levels of Interleukin-1β in the zebrafish brain. Data are represented as means ± S.E.M. (n = 10). For Bonferroni’s post hoc analyses: (A) Control vs. Fe3(6 mg/L): *** p < 0.0001. (B) Control vs. Fe2(3 mg/L): ** p < 0.001, Control vs. Fe3(6 mg/L): *** p < 0.0001. (C) Control vs. Fe3(6 mg/L): *** p < 0.0001. (D) Control vs. Fe1(1 mg/L): *** p < 0.0001, Control vs. Fe2(3 mg/L): *** p < 0.0001, Control vs. Fe3(6 mg/L): *** p < 0.0001. (E) Control vs. Fe1(1.5 mg/L): ** p < 0.001, Control vs. Fe2(3 mg/L): *** p < 0.0001, Control vs. Fe3(6 mg/L): *** p < 0.0001. (F) Control vs. Fe2(3 mg/L): ** p < 0.001, Control vs. Fe3(6 mg/L): *** p < 0.0001 |