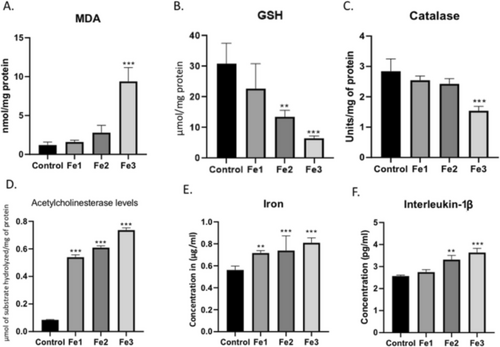
Ferrous Sulphate (1.5, 3, and 6 mg/L) disrupted the antioxidant mechanism in zebrafish and increased the levels of Acetylcholine esterase, Iron and Interleukin-1β in the zebrafish brain. (A-C) Graphical representation of the enzymes specific activity to estimate the oxidative stress in the zebrafish brain. (D) Graphical representation of the levels of Acetylcholinesterase in the zebrafish brain. (E) Graphical representation of the levels of tissue bounded iron levels in the brain of the zebrafish. (F) Graphical representation of the levels of Interleukin-1β in the zebrafish brain. Data are represented as means ± S.E.M. (n = 10). For Bonferroni’s post hoc analyses: (A) Control vs. Fe3(6 mg/L): *** p < 0.0001. (B) Control vs. Fe2(3 mg/L): ** p < 0.001, Control vs. Fe3(6 mg/L): *** p < 0.0001. (C) Control vs. Fe3(6 mg/L): *** p < 0.0001. (D) Control vs. Fe1(1 mg/L): *** p < 0.0001, Control vs. Fe2(3 mg/L): *** p < 0.0001, Control vs. Fe3(6 mg/L): *** p < 0.0001. (E) Control vs. Fe1(1.5 mg/L): ** p < 0.001, Control vs. Fe2(3 mg/L): *** p < 0.0001, Control vs. Fe3(6 mg/L): *** p < 0.0001. (F) Control vs. Fe2(3 mg/L): ** p < 0.001, Control vs. Fe3(6 mg/L): *** p < 0.0001
|
