|
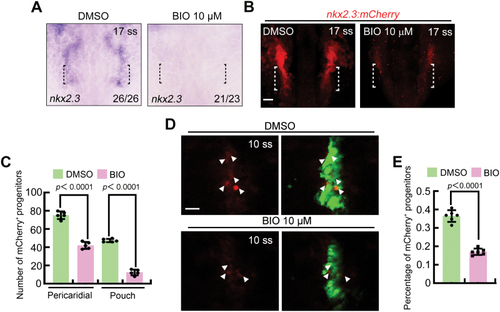
Excessive Wnt signal compromises PPP specification. (A) Expression of nkx2.3 in embryos treated with DMSO or BIO. The black dotted lines indicate the region where the PPPs are located. (B, C) Representative confocal sections showing Tg(nkx2.3:mCherry) embryos treated with DMSO or BIO (B). The PPPs are indicated by white dotted lines. Scale bar, 20 μm. Quantitative analysis of PPP cell numbers is shown in (C). The group values are expressed as mean ± SD. (D, E) Confocal images illustrating the specification of nkx2.3+ pouch progenitors from the pharyngeal endoderm. White arrowheads indicate the presence of GFP+/mCherry+ cells in Tg(nkx2.3:mCherry;sox17:GFP) embryos (D). Scale bar, 20 μm. Ratio of mCherry+ PPPs to the GFP+ pharyngeal endoderm of embryos treated with DMSO or BIO was achieved from three independent assays (E). The group values are expressed as mean ± SD.
|