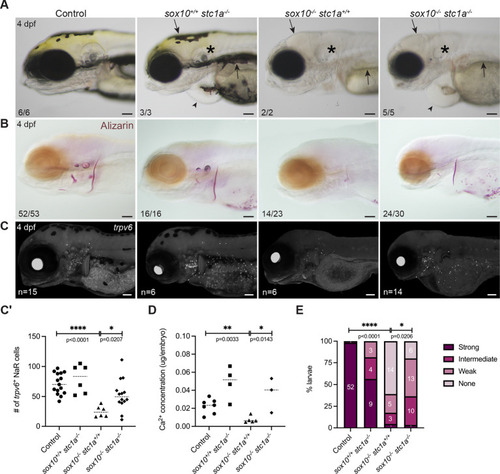
stc1a is epistatic to sox10 in control of systemic calcium content. (A) Brightfield images of sox10 and stc1a controls and mutants at 4 dpf. Double mutants phenocopy the loss of pigment (arrows) and the inner ear malformations (asterisks) of single sox10 mutants and the cardiac edema of the stc1a mutant (arrowheads). (B-C′) Loss of stc1a on the sox10 mutant background improves mineralization (B) and the number of trpv6+ ionocytes (C) at 4 dpf, quantified in C′ (unpaired t-test; P=0.0207, d.f.=18). In A,B, numbers in panels indicate the proportion of larvae of that genotype with the presented phenotype. (D) Calcium quantification shows an increase (unpaired t-test; P=0.143, d.f.=6) in calcium levels in sox10−/−; stc1a−/− compared to sox10−/−. (E) Quantitation of mineralization levels in sox10; stc1a clutches grouped based on the intensity of Alizarin Red staining. There was a significant increase in the proportion of double mutants with detectable mineralization compared with sox10 single mutants (χ2; P=0.0206, d.f.=3). In C′-E, ‘control’ includes wild-type and heterozygous larvae. Dashed lines indicate the median. Scale bars: 100 µm.
|
