
Fig. 1
- ID
- ZDB-FIG-250902-74
- Publication
- Abramova et al., 2025 - Disruption of grin2A, an epilepsy-associated gene, produces altered spontaneous swim behavior in zebrafish
- Other Figures
- All Figure Page
- Back to All Figure Page
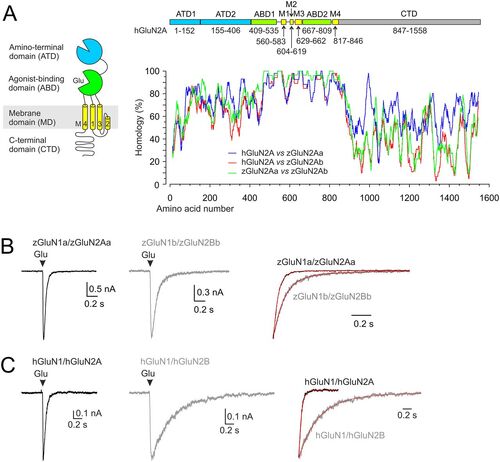
Protein sequence homology and functional properties of recombinant zebrafish NMDARs. A, Diagram of the domains comprising the hGluN2A subunit: the extracellular ATD and ABD; the membrane TMD with transmembrane segments M1, M3, M4, and the M2 pore loop forming the ion channel; and the intracellular CTD. A graph showing the amino acid alignment between hGluN2A (NP_001127879.1) and each of the zebrafish GluN2A paralogs zGluN2Aa and zGluN2Ab (XP_021329529.1, XP_009304490.1). Values indicate the percentage of homology calculated as a relative BLOSUM62 substitution matrix score between the ClustalW alignment of the indicated subunits. Each position in the alignment was scored by 100×2BLOSUM62(ri,ci)−BLOSUM62(ri,ri) with ri and ci corresponding to ith amino acid in the “reference” and “compared” sequence, respectively. A running average of 25 amino acid segments was then used for the plotting. Above the graph is the linear representation of the hGluN2A subunit. The colors correspond to the diagram, with the ATD shown in blue, the ABD in green, the TMD in yellow, and the CTD in gray. The amino acid numbers that make up each domain are indicated. B, C, Representative current recordings in HEK293T cells expressing zGluN1a/zGluN2Aa or zGluN1b/zGluN2Bb receptors (B) or hGluN1/hGluN2A or hGluN1/GluN2B receptors (C), with responses evoked by a brief (10–15 ms) application of 1 mM glutamate in the continuous presence of 100 µM glycine. The responses normalized to the peak amplitude are shown on the right (red lines indicate the double exponential function fit to the data, τw = 36.2 ms for zGluN1a/zGluN2Aa and τw = 118.9 ms for zGluN1b/zGluN2Bb; τw = 58.8 ms for hGluN1/hGluN2A and τw = 510 ms for hGluN1/hGluN2B). |