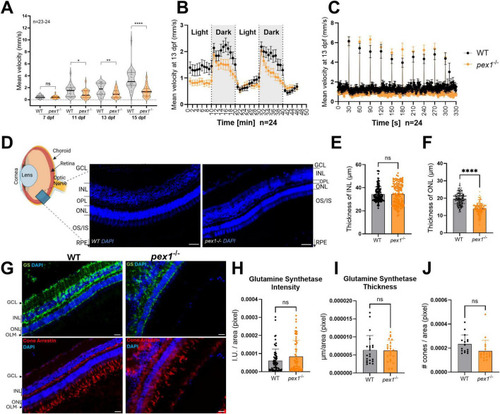
Pex1 deficiency leads to behavioral changes in larvae and perturbed retinal architecture in adult fish. (A) The total mean velocity of 7, 11, 13, and 15 dpf larvae was recorded under constant light conditions for 1 hr. Each dot represents the mean velocity of one larva (n = 23–24). (B) Behavioral profiles (1-min intervals) of 13 dpf larvae under alternating light/dark conditions in 10-min interval cycles. (C) Startle response profile (1-sec intervals) of 13 dpf larvae upon acoustic stimuli applied in 30-sec intervals. Each dot in (B,C) represents the mean velocity (± SEM) of 24 larvae recorded on two independent plates. Statistical significance in (A) was determined by unpaired t-test (*p < 0.033; **p < 0.0021, ****p < 0.0001). (D) Zebrafish eye representation showing DAPI counterstaining of nuclei (blue) across the retinal layers—GCL, INL, OPL, and ONL—in 7-month-old animals. Scale bars represent 10 μm. (E,F) Six measurements were taken from six images per eye, with three images on each side of the optic nerve. For each side, these three images were positioned equidistant from the optic nerve. Each dot represents an individual measurement. Values are presented as means ± SDs; statistical analysis was performed using an unpaired t-test (****p < 0.0001). (G) Glutamine synthetase (GS; green) and cone arrestin (red) immunostaining highlighting Müller glial and cone cells, respectively. Scale bars represent 5 μm. (H,I) Quantification of Müller cell fluorescence intensity and cell layer thickness (μm) normalized to Müller cell area (operationally defined as the area within the retinal section that shows positive GS labeling). Measurements were taken from three images lateral to the optic nerve on both left and right sides (6 images/eye). The Müller cells were delineated based on GS staining from the outer limiting membrane to the inner nuclear layer. Each dot represents a single measurement. (J) Normalized cone density (number of cones/area). Cones were automatically identified using a custom Matlab script, with manual correction for overlapping signals. Each dot represents one single image taken from three images lateral to the optic nerve, as described above. For (H–J), means ± SDs are shown and statistical analysis was performed using an unpaired t-test (ns, non-significant). Three (E,F) or four (H–J) eyes from different animals were analyzed per genotype. GCL, ganglion cell layer; INL, inner nuclear layer; OPL, outer plexiform layer; ONL, outer nuclear layer; OS/IS, outer/inner segment; RPE, retinal pigment epithelium; GS, glutamine synthetase; OLM, outer limiting membrane; I.U., intensity units.
|
