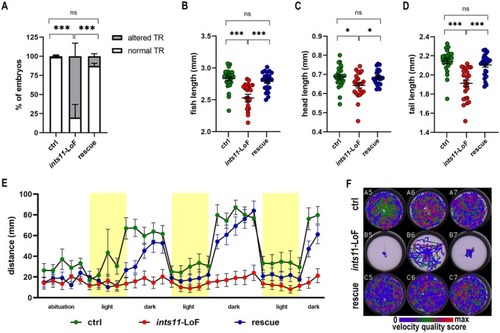
ints11‐LoF causes morphological defects and impairs light–dark–dependent motor behavior in zebrafish larvae. (A) Touch‐evoked escape response assay performed at 2.5 dpf in controls (n = 25), ints11‐LoF (n = 26) and ints11‐rescue injected with ints11 mRNA (n = 30) embryos. Proportion of embryos with normal TR: ctrl 24/25; ints11‐LoF: 5/26; rescue: 26/30. Proportion of embryos with altered TR: Ctrl 1/25; ints11‐LoF: 21/26; rescue: 4/30. In the histograms the percentage of embryos is expressed as mean ± SEM. Chi‐squared test with Holm–Bonferroni. ***p < 0.001. ns not significant. Refer to Table S3 for raw statistical data. (B–D) Morphological analysis of 5 dpf larvae obtained from the Ramona Optics MCAM system. Each dot represents the value (expressed in millimeters, mm) of each embryo and mean ± SEM are depicted by black bars: (B) fish length (ctrl: 2832 ± 0.03363; ints11‐LoF: 2529 ± 0.05823; rescue: 2789 ± 0.02823), (C) head length (ctrl: 0.6881 ± 0.01165; ints11‐LoF: 0.6428 ± 0.01355; rescue: 0.6848 ± 0.08033) and (D) tail length (ctrl: 2144 ± 0.02499; ints11‐LoF: 1913 ± 0.03386; rescue: 2105 ± 0.02340). ctrl: N = 24; ints11‐LoF: N = 24; rescue (ints11‐LoF injected with ints11 mRNA): N = 24. Biological duplicate (two independent experiments, in each n = 12/category). Kruskal–Wallis non‐parametric test with Dunn's post hoc (B, D) and ordinary one‐way ANOVA, Holm‐Sidak's post hoc (C). ***p < 0.001; *p < 0.05; ns not significant. Refer to Table S4 for raw statistical data. (E) Locomotor activity traces recorded under alternating light and dark periods in 5 dpf controls (green), ints11‐LoF (red) and rescue larvae (blue). Each dot represents an individual time point and reflects the mean locomotor activity calculated from 24 embryos. (F) Tracking of zebrafish larval movements using a speed qualitative color scale.
|
