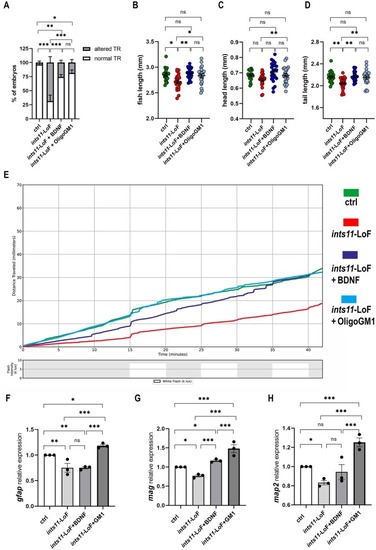
Pharmacological administration of BDNF and OligoGM1 rescues the phenotype of ints11‐LoF model. (A) Touch‐evoked escape response assay performed at 2.5 dpf in controls (n = 65), ints11‐LoF (n = 80) and ints11‐rescue treated with BDNF (n = 74) or OligoGM1 (n = 73). Proportion of embryos with normal TR: ctrl 63/65; ints11‐LoF: 25/80; ints11‐LoF+BDNF: 55/74; ints11‐LoF+OligoGM1: 59/73. Proportion of embryos with altered TR: ctrl 2/65; ints11‐LoF: 55/80; ints11‐LoF+BDNF: 19/74; ints11‐LoF+OligoGM1: 14/73. In the histograms the percentage of embryos is expressed as mean ± SEM. ***p < 0.001; **p < 0.01; *p < 0.05; ns not significant. Chi‐squared test with Holm–Bonferroni. Refer to Table S3 for raw statistical data. (B–D) Morphological analysis of 5 dpf larvae obtained from the Ramona Optics MCAM system. Each dot represents the value (expressed in millimeters, mm) of each embryo and mean ± SEM are depicted by black bars. (B) Fish length (ctrl: 2.849 ± 0.0289; ints11‐LoF: 2.713 ± 0.0324; ints11‐LoF+BDNF: 2.877 ± 0.0221; ints11‐LoF+OligoGM1: 2.833 ± 0.0349) (C) head length (ctrl: 0.6841 ± 0.0076; ints11‐LoF: 0.6534 ± 0.0098; ints11‐LoF+BDNF: 0.7946 ± 0.0130; ints11‐LoF+oligoGM1: 0.6841 ± 0.0112) and (D) tail length (ctrl: 2.161 ± 0.0230; ints11‐LoF: 2.044 ± 0.0229; ints11‐LoF+BDNF: 2.173 ± 0.0183; ints11‐LoF+oligoGM1: 2.148 ± 0.0281). ctrl: N = 19; ints11‐LoF: N = 22; rescue (BDNF): N = 23; rescue (OligoGM1): N = 22. Biological duplicate. Ordinary one‐way ANOVA, Tukey post hoc. ***p < 0.001; *p < 0.001; *p < 0.05; ns not significant. (E) Cumulative distance traveled by larvae from the different experimental categories in response to light and dark variations. (F–H) RT‐qPCR expression analyses at 4 dpf for (F) gfap, (G) mag, and (H) map2 in the different categories. Data are presented as mean ± SEM after analyses with the 2−ddCt method. According to 2−ddCt method, ctrl is set at mean 1. Each dot represents the mean of three technical replicates from one biological batch. gfap (ints11‐LoF: 0.7503 ± 0.0876; ints11‐LoF+BDNF: 0.7504 ± 0.0203; ints11‐LoF+OligoGM1: 1.183 ± 0.0279); mag (ints11‐LoF: 0.7687 ± 0.0297; ints11‐LoF+BDNF: 1.166 ± 0.0238; ints11‐LoF+OligoGM1: 1.480 ± 0.1047); map2 (ints11‐LoF: 0.8318 ± 0.0231; ints11‐LoF+BDNF: 0.9431 ± 0.0776; ints11‐LoF+OligoGM1: 1.252 ± 0.0455). In 4F‐H, GM1 represents the abbreviation of OligoGM1. Kruskal–Wallis non‐parametric test with Dunn's post hoc. *p < 0.05, ns: Not significant. Refer to Table S4 for raw statistical data.
|
