
FIGURE
FIGURE 3
- ID
- ZDB-FIG-260520-76
- Publication
- Ononuju et al., 2026 - Employing zebrafish to understand genetic drivers of epilepsy-related comorbid behaviors
- Other Figures
- All Figure Page
- Back to All Figure Page
FIGURE 3
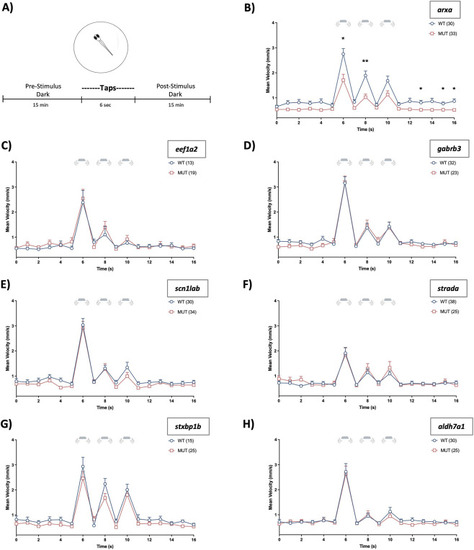
Tap startle response. (A) Schematic highlighting that after acclimation, plated 6 dpf larvae are recorded for 15 min before and after tap/vibrational stimuli exposure (three taps). (B–H) Plots depict larval movement assessed via mean velocity (mm/s) measurements. Time = 0 is 14:54 (min:s) after the beginning of the recording. Vibrating microplate icon signifies periods where tap stimuli is present. Data are shown as mean ± SEM. Post hoc Sidak’s multiple comparison test *p < 0.05 and **p < 0.01. |
Expression Data
Expression Detail
Antibody Labeling
Phenotype Data
| Fish: | |
|---|---|
| Condition: | |
| Observed In: | |
| Stage: | Day 6 |
Phenotype Detail
Acknowledgments
This image is the copyrighted work of the attributed author or publisher, and
ZFIN has permission only to display this image to its users.
Additional permissions should be obtained from the applicable author or publisher of the image.
Full text @ Front Pharmacol