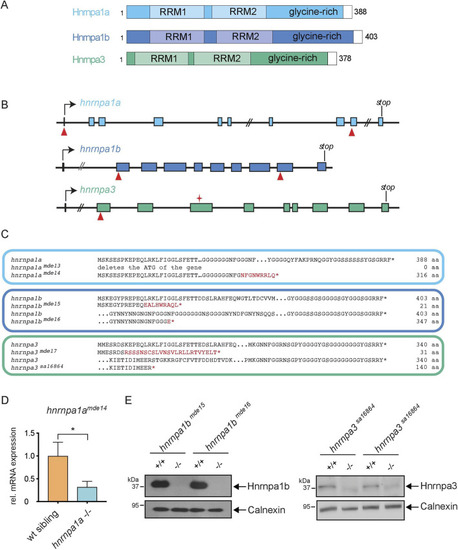
Generation of Hnrnpa1a, Hnrnpa1b and Hnrnpa3 loss of function alleles. (A) Schematic representation of zebrafish Hnrnpa1a (turquoise), Hnrnpa1b (blue), and Hnrnpa3 (green) with domain structure. RRM = RNA recognition domain; glycine-rich = glycine-rich domain. White boxes indicate the nuclear localization signal. Numbers indicate the first and last amino acid of the respective protein. (B) Scheme of the genomic organization of the hnrnpa1a, hnrnpa1b and hnrnpa3 locus. Red arrow heads indicate binding sites for the gRNAs. Symbol in exon3 of hnrnpa3 indicates location of the hnrnpasa16864 mutation. (C) Overview of the alleles generated with allele designation. Reference wildtype protein sequence on top. New amino acids generated after the frameshift mutations are indicated in red. Asterisks indicate stop codon. Number at the end of the sequence indicates the predicted length of the respective protein. (D)hnrnpa1a mRNA levels were measured in hnrnpa1amde14−/− mutants as no Hnrnpa1a specific antibody is available. hnrnpa1a mRNA levels are significantly reduced in the brains of hnrnpa1amde14−/− mutants. (*p < 0.02) n = 4. Error bar indicates S.E.M. Normalized to rflp13a and elf1a2. Student’s t-test. (E) Western blot analysis with Hnrnpa1b and Hnrnpa3 specific antibodies. The Hnrnpa1b specific band is absent in brain samples derived from hnrnpa1bmde13−/− and hnrnpa1bmde14−/− mutants, whereas an Hnrnpa1b specific signal was detected in brain samples of the respective hnrnpa1b+/+ siblings. The Hnrnpa3 specific band was absent in all brain samples derived from hnrnpa3sa16864−/− mutants, whereas an Hnrnpa3 specific signal was observed in brain samples of hnrnpa3+/+ siblings (data shown is from two biological replicates). Calnexin serves as a loading control in both blots.
|
