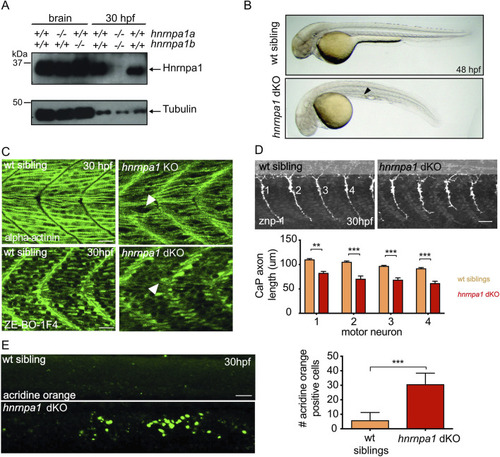
Hnrnpa1 dKO show a lipid, muscle, motor neuron phenotype and increased cell death (A) The antibody HA1-CT (VM) AN351 detects Hnrnpa1a and Hnrnpa1b since a band at the expected size of Hnrnpa1a and Hnrnpa1b is detectable in wildtype, hnrnpa1a−/− and hnrnpa1b−/− zebrafish brains. No band appears at the expected size in hnrnpa1 dKO embryos 30 hpf further supporting complete loss of Hnrnpa1 protein (overexposed blot to show absence of band in lane 5). Tubulin serves as a loading control. (B) After 48 hpf hnrnpa1 dKO embryos show reduced blood flow and a thinned yolk extension (arrowhead). (C) Antibody staining of 30 hpf wildtype and hnrnpa1 dKO embryos with the α-actinin specific antibody (green). Antibody staining of 30 hpf wildtype and hnrnpa1 dKO embryos with the myosin specific antibody ZE-BO-1F4 (green). Pictures taken by confocal laser scanning microscopy using the 488 nm laser. Lateral view. Anterior to the left. Scale bar represents 25 µm (D) Examples of whole-mount IF stainings of 30 hpf wildtype compared to hnrnpa1 dKO mutants stained with znp-1 antibody. The four CaP axons anterior to the end of the yolk extension are shown. Images are taken with the spinning disk Cell Observer. Maximum intensity projection. Lateral view. Anterior to the left. Scale bar: 25 µm. A comparison of the CaP axon lengths of wildtype (orange) and hnrnpa1 KO (red) at 30 hpf revealed reduced CaP axon outgrowth in hnrnpa1 dKO (**p < 0.001; ***p < 0.0001; n = 16. Error bar indicates S.E.M. Two-way ANOVA. Bonferroni post-test. (E)hnrnpa1 dKO show increased cell death in the spinal cord. Images of wildtype and hnrnpa1 dKO stained with Acridine Orange (green), which is taken up by apoptotic and necrotic cells (only part of the spinal cord in the trunk is shown). Lateral view. Anterior to the left. Maximum intensity projection of stacks of ten 0.9 µm images. Images were taken with laser scanning confocal microscope using the 488 nm laser. Quantification of Acridine Orange positive cells within the spinal cord of wildtype and hnrnpa1 dKO. Number of Acridine Orange positive cells is significantly increased in hnrnpa1 dKO. Error bars indicate S.E.M; n = 9 embryos per experiment; ***p < 0.0001; Student’s t-test. Scalebar represents 40 µm.
|
