
- Title
-
Sex disparity in zebrafish liver cell proliferation after partial hepatectomy is regulated by sex hormone receptors and the S100A1-YAP signaling cascade
- Authors
- Zhu, M., Li, Y., Shen, Q., Gong, Z., Liu, D.
- Source
- Full text @ Dis. Model. Mech.
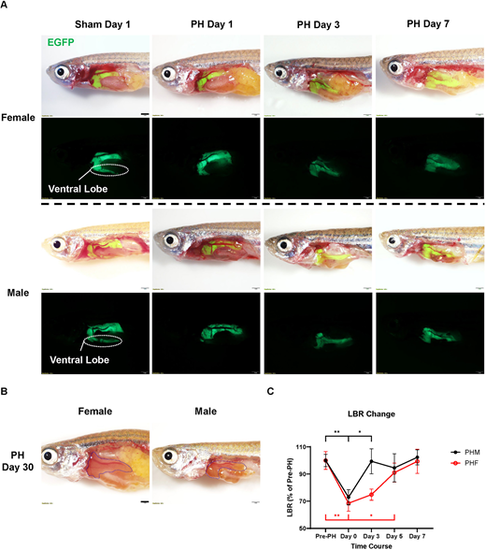
Compensatory liver regeneration in zebrafish of both sexes following partial hepatectomy (PH). (A) Representative fluorescence images of EGFP+ zebrafish within a week after PH or sham surgery (n=3). (B) Representative images of male and female zebrafish 30 days after PH (n=3). Yellow dotted lines outline the livers. (C) Changes in the liver-to-body ratio (LBR) of zebrafish of both sexes during PH-induced liver regeneration (n=5). Scale bars: 1 mm. *P≤0.05, **P≤0.01 (two-tailed unpaired Student's t-test). PHF, female zebrafish with partial hepatectomy; PHM, male zebrafish with partial hepatectomy. |
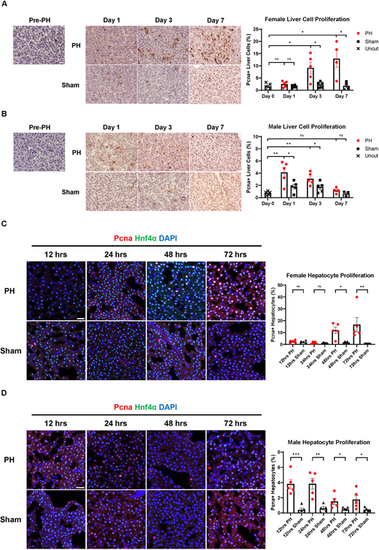
Sex disparity in liver cell proliferation during PH-induced zebrafish liver regeneration. (A) Immunohistochemical (IHC) staining of Pcna in female zebrafish livers before and after PH or sham surgery. Quantification of Pcna+ proliferating liver cells is shown on the right. Each symbol represents one zebrafish. (B) IHC staining of Pcna in male zebrafish livers before and after PH or sham surgery. Quantification of Pcna+ proliferating liver cells is shown on the right. Each symbol represents one zebrafish. (C) Immunofluorescence (IF) staining of Pcna and Hnf4α in female zebrafish livers following PH or sham surgery. Quantification of Pcna and Hnf4α double-positive proliferating hepatocytes is shown on the right. Each symbol represents one zebrafish. (D) IF staining of Pcna and Hnf4α in male zebrafish livers following PH or sham surgery. Quantification of Pcna and Hnf4α double-positive proliferating hepatocytes is shown on the right. Each symbol represents one zebrafish. Scale bars: 20 μm. ns, not significant (P>0.05); *P≤0.05, **P≤0.01, ***P≤0.001 (two-tailed unpaired Student's t-test). |
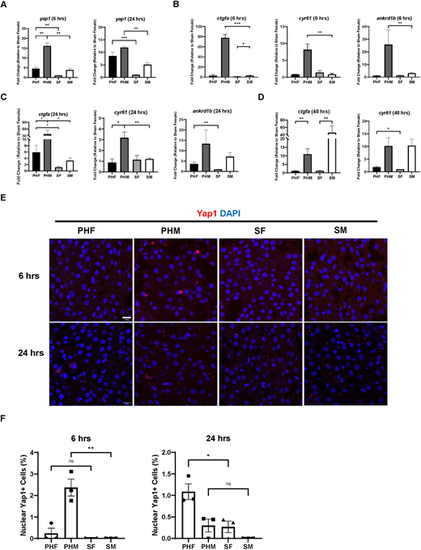
Earlier initiation of liver regeneration in male zebrafish is associated with earlier Yap1 activation in male livers following PH. (A) Expression of yap1 in zebrafish livers of both sexes at 6 h and 24 h post-PH as determined by RT-qPCR (n=3). (B,C) Expression of ctgfa, cyr61 and ankrd1b in zebrafish livers of both sexes at 6 h (B) and 24 h (C) post-PH as determined by real-time quantitative PCR (RT-qPCR) (n=4 for ankrd1b at 6 h, n=3 for the remaining groups). (D) Expression of ctgfa and cyr61 in zebrafish livers of both sexes at 48 h post-PH as determined by RT-qPCR (n=3). (E) IF staining of Yap1 in the zebrafish liver of both sexes at 6 h and 24 h post-PH. (F) Quantification of Yap1-positive liver cells based on E. Each symbol represents one zebrafish. Scale bars: 10 μm. ns, not significant (P>0.05); *P≤0.05, **P≤0.01, ***P≤0.001 (two-tailed unpaired Student's t-test). |
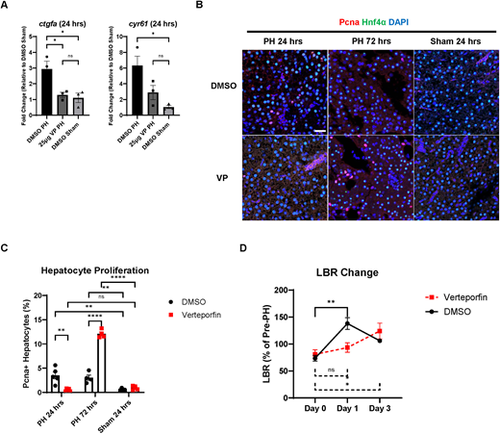
Effects of Yap1 inhibition on male zebrafish liver regeneration following PH. (A) Expression of ctgfa and cyr61 in dimethyl sulfoxide (DMSO)/verteporfin (VP)-pretreated male zebrafish livers at 6 h post-PH/sham surgery as determined by RT-qPCR. Each symbol represents one zebrafish. (B) IF staining of Pcna and Hnf4α in DMSO/VP-pretreated male zebrafish liver following PH or sham surgery. (C) Quantification of Pcna and Hnf4α double-positive proliferating hepatocytes based on B. Each symbol represents one zebrafish. (D) Changes in LBR of DMSO/VP-pretreated male LiPan zebrafish during PH-induced liver regeneration (n=3). Scale bar: 20 μm. ns, not significant (P>0.05); *P≤0.05, **P≤0.01, ****P≤0.0001 (two-tailed unpaired Student's t-test). |
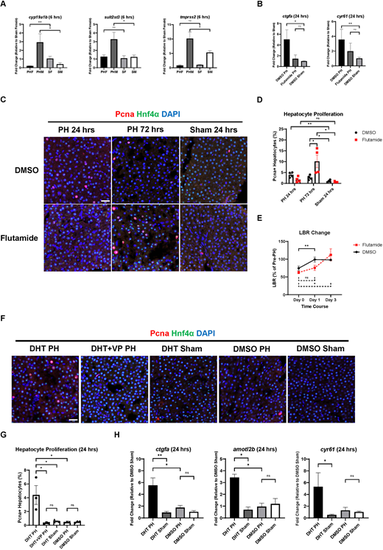
Androgen receptor (AR) activity regulates male zebrafish liver regeneration following PH in a Yap1-dependent manner. (A) Expression of cyp19a1b, sult2st3 and tmprss2 in zebrafish livers of both sexes at 6 h post-PH as determined by RT-qPCR (n=3 for cyp19a1b, n=4 for the remaining groups). (B) Expression of ctgfa and cyr61 in flutamide/DMSO-treated male zebrafish livers at 24 h post-PH/sham surgery as determined by RT-qPCR (n=3). (C) IF staining of Pcna and Hnf4α in DMSO/flutamide-treated male zebrafish livers following PH or sham surgery. (D) Quantification of Pcna and Hnf4α double-positive proliferating hepatocytes based on C. Each symbol represents one zebrafish. (E) Changes in LBR of DMSO/flutamide-pretreated LiPan male zebrafish during PH-induced liver regeneration (n=4). (F) IF staining of Pcna and Hnf4α in dihydrotestosterone (DHT)/DHT+VP/DMSO-pretreated zebrafish livers of both sexes at 24 h post-PH. (G) Quantification of Pcna and Hnf4α double-positive proliferating hepatocytes based on F. Each symbol represents one zebrafish. (H) Expression of ctgfa, amotl2b and cyr61 in DHT/DMSO-pretreated male zebrafish livers at 24 h post-PH as determined by RT-qPCR (n=3). Scale bars: 20 μm. ns, not significant (P>0.05); *P≤0.05, **P≤0.01 (two-tailed unpaired Student's t-test). |
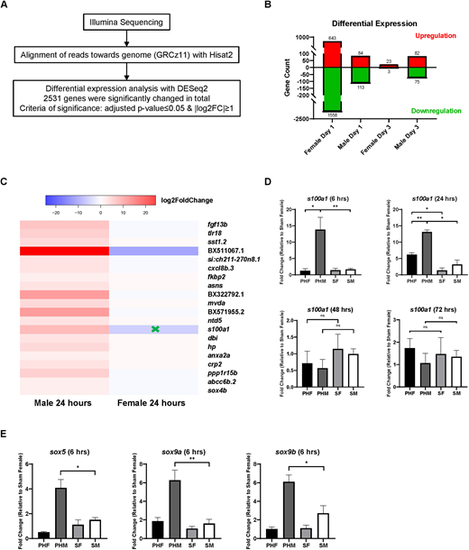
Sex disparity in transcriptomic regulation during PH-induced zebrafish liver regeneration. (A) Workflow of differentially expressed gene analysis based on the RNA-sequencing results of PH-treated zebrafish livers of both sexes versus the corresponding sham-treated livers on Day 1 and Day 3. log2FC, log2 fold change. (B) Quantification of the significantly upregulated/downregulated genes identified in A. (C) The top 20 genes that were significantly upregulated only in male livers at 24 h post-PH. The green cross indicates significant downregulation. (D) Expression of s100a1 in zebrafish liver of both sexes following PH/sham surgeries as determined by RT-qPCR (n=3). (E) Expression of sox5, sox9a and sox9b in zebrafish liver of both sexes at 6 h post-PH as determined by RT-qPCR (n=3 for sox5, n=4 for the remaining groups). ns, not significant (P>0.05); *P≤0.05, **P≤0.01 (two-tailed unpaired Student's t-test). |
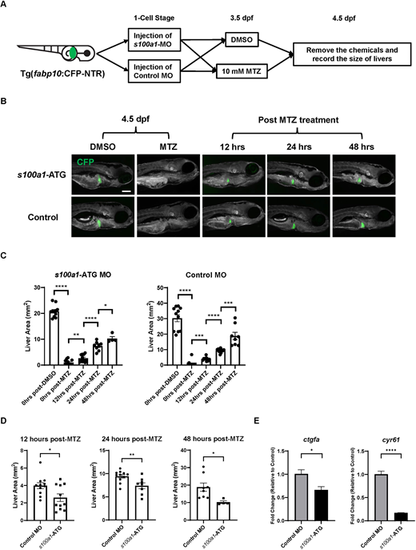
Effects of s100a1 knockdown on liver expansion in zebrafish larvae during chemical injury-induced liver regeneration. (A) Experimental design for investigating the effects of s100a1 knockdown on liver regeneration of NTR+ larvae following metronidazole (MTZ)-induced hepatocyte ablation. NTR+ larvae injected with morpholino (MO) were exposed to 10 mM MTZ or DMSO for 24 h from 3.5 days post fertilization (dpf). (B) Fluorescence images of MO-injected NTR+ larvae following 24 h of DMSO or MTZ treatment. (C,D) Measurement and comparison of the area of CFP+ livers in MO-injected NTR+ larvae based on B. Each symbol represents one larva. (E) Expression of ctgfa and cyr61 in MO-injected NTR+ larvae 24 h after MTZ treatment as determined by RT-qPCR (n=3). Each sample used for quantitative PCR contained cDNA from 15 larvae. Scale bar: 200 μm. *P≤0.05, **P≤0.01, ***P≤0.001, ****P≤0.0001 (two-tailed unpaired Student's t-test). |

Effects of s100a1 haploinsufficiency on male zebrafish liver regeneration following PH. (A) IF staining of Pcna and Hnf4α in s100a1+/− and wild-type (WT) male zebrafish livers following PH or sham surgery. (B) Quantification of Pcna and Hnf4α double-positive proliferating hepatocytes based on A. Each symbol represents one zebrafish. (C) LBR changes in s100a1+/− males compared with WT males during PH-induced liver regeneration (n=4). (D) Expression of s100a1, ctgfa, amotl2b and cyr61 in s100a1+/− and WT livers at 6 h or 24 h post-PH as determined by RT-qPCR (n=3). Scale bar: 20 μm. ns, not significant (P>0.05); *P≤0.05, **P≤0.01 (two-tailed unpaired Student's t-test). |