
- Title
-
Engineering an fgfr4 knockout zebrafish to study its role in development and disease
- Authors
- Harrison, E.N., Jay, A.N., Kent, M.R., Sukienik, T.P., LaVigne, C.A., Kendall, G.C.
- Source
- Full text @ PLoS One
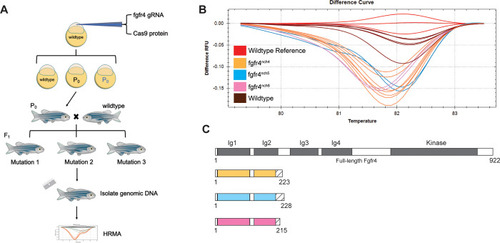
Three strains of zebrafish (A) Schematic of generation of |
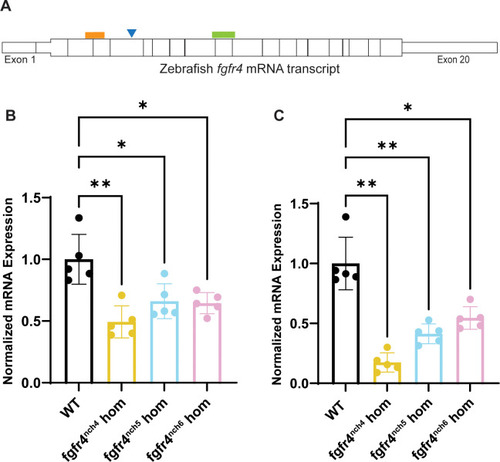
Zebrafish (A) Schematic of wildtype zebrafish |
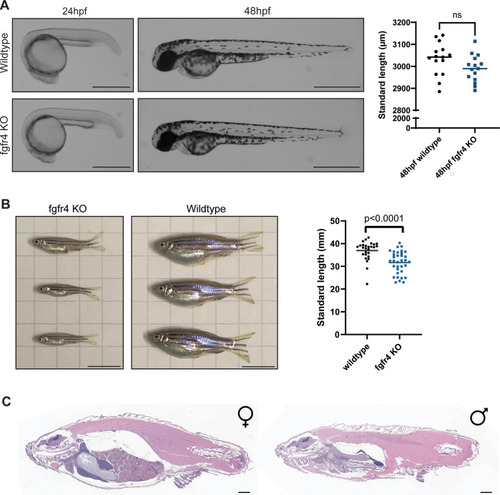
Homozygous (A) Representative images from a phenotypic analysis of embryonic zebrafish. Homozygous |