FIGURE

Fig 2

ID
ZDB-FIG-241125-29
Publication
Harrison et al., 2024 - Engineering an fgfr4 knockout zebrafish to study its role in development and disease
Other Figures
All Figure Page
Back to All Figure Page
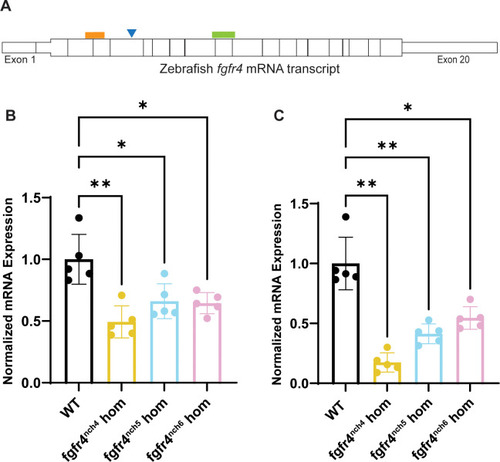
Fig 2

Zebrafish fgfr4 knockout validated by real time quantitative polymerase chain reaction (RT-qPCR).

(A) Schematic of wildtype zebrafish fgfr4 mature mRNA transcript and regions targeted for RT-qPCR. Blue triangle indicates approximate fgfr4 crispant mutation site for all strains relative to primers. Orange box indicates region 5’ of mutation site targeted by RT-qPCR primers, and green box indicates region 3’ of mutation site targeted by RT-qPCR primers. Relative expression of fgfr4 mRNA as measured by RT-qPCR targeting the regions 5’ (B) and 3’ (C) of the sequence mutation. Expression is normalized to gapdh and rpl13a. Each point represents a pool of n = 12, 24 hours post-fertilization (hpf) zebrafish embryos derived from a maternal zygotic. Multiple points represent biological replicates, while three technical replicates were used to generate each biological replicate. Error bar is the mean ± standard deviation. P values were calculated using a one-way Brown-Forsythe and Welch ANOVA, correcting for multiple comparisons with a Dunnett T3 test.

Expression Data

Expression Detail
Antibody Labeling
Phenotype Data

Phenotype Detail
Acknowledgments
This image is the copyrighted work of the attributed author or publisher, and ZFIN has permission only to display this image to its users. Additional permissions should be obtained from the applicable author or publisher of the image. Full text @ PLoS One