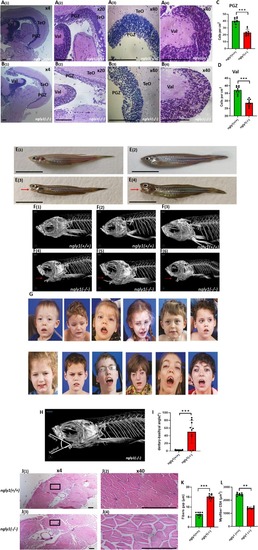
Adult ngly1(−/−)zebrafish display the hallmarks of NGLY1‐CDDG. Representative images of ngly1(+/+) (A(1–4)) and ngly1(−/−) (B1–4) coronal brain sections (slides, hematoxylin and eosin staining) displaying massive loss of neural cells in ngly1(−/−). Magnifications: A1, B1‐x4, A2, B2‐x20 and A [3, 4], B [3, 4]‐x40. (C, D) Quantification of cell numbers in the periventricular gray zone (PGZ) (C) and lateral division of valvula cerebelli (Val) (D). ***T‐test p < 0.001 (N = 10 in each group). Scale bar: 100 μm. Gross morphology of adult (E(1)–E(2)) ngly1(+/+) and (E(3)–E(4)) ngly1(−/−) fish. μCT imaging of ngly1(+/+) (F(1)–F(3)) and ngly1(−/−) (F(4)–F(6)); red arrows represent the basihyal bone dislocation. (G) Facial features of human patients include upturned nasal tip, hypotonic facies, ptosis, brachycephaly, thinned facies, hollowed cheeks, and visible zygomatic arches. ** (H) Schematic representation of dentary‐basihyal angle which was significantly greater in ngly1(−/−). (I) Quantification of dentary‐basihyal angle. ***T‐test, p < 0.001 (N = 10 in each group). Scale bar: 1 cm. (J) Coronal trunk section histology staining (hematoxylin and eosin) of (J(1)–J [2]) ngly1(+/+) and (J(3)–J [4]) ngly1(−/−). ngly1(−/−) showed reduced in muscle fiber content of trunk skeletal muscle. Zoom‐in of muscle regions in (J [1]), (J [3])‐X4 and (J [2]), (J [4]) –X40. (K) Quantification of gaps between muscle fibers, *** T‐test p < 0.001 (N = 8 in each group). (L) Quantification of muscle fibers CSA, ** T‐test p < 0.01 (N = 8 in each group). Scale bar:100 μm. **Reprinted from Genetics in Medicine. Prospective phenotyping of NGLY1‐CDDG, the first congenital disorder of deglycosylation. Lam, C., Ferreira, C., Krasnewich, D., Toro, C., Latham, L., Zein, W. M., Lehky, T., Brewer, C., Baker, E. H., Thurm, A., Farmer, C. A., Rosenzweig, S. D., Lyons, J. J., Schreiber, J. M., Gropman, A., Lingala, S., Ghany, M. G., Solomon, B., Macnamara, E., Davids, M., Wolfe, L. 19, 160–168 (2017). with permission from Elsevier**.
|

