FIGURE SUMMARY
Title

Impaired Proteostasis is Linked to Neurological Pathology in a Zebrafish NGLY1 Deficiency Model

Authors
Mesika, A., Nadav, G., Ben-David, S., Kalfon, L., Shochat, C., Nasra, R., Livoff, A., Karasik, D., Falik-Zaccai, T.C.
Source
Full text @ J. Inherit. Metab. Dis.

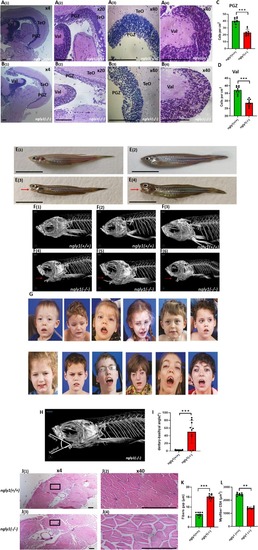
Adult ngly1(−/−)zebrafish display the hallmarks of NGLY1‐CDDG. Representative images of ngly1(+/+) (A(1–4)) and ngly1(−/−) (B1–4) coronal brain sections (slides, hematoxylin and eosin staining) displaying massive loss of neural cells in ngly1(−/−). Magnifications: A1, B1‐x4, A2, B2‐x20 and A [3, 4], B [3, 4]‐x40. (C, D) Quantification of cell numbers in the periventricular gray zone (PGZ) (C) and lateral division of valvula cerebelli (Val) (D). ***T‐test p < 0.001 (N = 10 in each group). Scale bar: 100 μm. Gross morphology of adult (E(1)E(2)) ngly1(+/+) and (E(3)E(4)) ngly1(−/−) fish. μCT imaging of ngly1(+/+) (F(1)F(3)) and ngly1(−/−) (F(4)F(6)); red arrows represent the basihyal bone dislocation. (G) Facial features of human patients include upturned nasal tip, hypotonic facies, ptosis, brachycephaly, thinned facies, hollowed cheeks, and visible zygomatic arches. ** (H) Schematic representation of dentary‐basihyal angle which was significantly greater in ngly1(−/−). (I) Quantification of dentary‐basihyal angle. ***T‐test, p < 0.001 (N = 10 in each group). Scale bar: 1 cm. (J) Coronal trunk section histology staining (hematoxylin and eosin) of (J(1)–J [2]) ngly1(+/+) and (J(3)–J [4]) ngly1(−/−). ngly1(−/−) showed reduced in muscle fiber content of trunk skeletal muscle. Zoom‐in of muscle regions in (J [1]), (J [3])‐X4 and (J [2]), (J [4]) –X40. (K) Quantification of gaps between muscle fibers, *** T‐test p < 0.001 (N = 8 in each group). (L) Quantification of muscle fibers CSA, ** T‐test p < 0.01 (N = 8 in each group). Scale bar:100 μm. **Reprinted from Genetics in Medicine. Prospective phenotyping of NGLY1‐CDDG, the first congenital disorder of deglycosylation. Lam, C., Ferreira, C., Krasnewich, D., Toro, C., Latham, L., Zein, W. M., Lehky, T., Brewer, C., Baker, E. H., Thurm, A., Farmer, C. A., Rosenzweig, S. D., Lyons, J. J., Schreiber, J. M., Gropman, A., Lingala, S., Ghany, M. G., Solomon, B., Macnamara, E., Davids, M., Wolfe, L. 19, 160–168 (2017). with permission from Elsevier**.

Adult ngly1(−/−)fish feature cellular effects resulting from NGLY1 deficiency. (A) RT‐qPCR quantification of aqp1a.1 mRNA levels in zebrafish eye. ** T‐test p < 0.01 (ngly1(+/+)n = 3, ngly1(−/−)n = 3). (BE) Western blot analysis of aqp1a.1 protein from adult zebrafish eyes (B, C); *** T‐test p < 0.001 (ngly1(+/+)n = 3, ngly1(−/−)n = 3), and brain (D, E) ** T‐test p < 0.01 (ngly1(+/+)n = 3, ngly1(−/−)n = 3). β‐actin was used as a loading control. (FI) Transmission electron microscopy images showing mitochondrial fragmentation in the mutant zebrafish brain (white arrows). (J) Fragmented mitochondria were quantified by Form Factor metric, calculated by the formula: Form Factor = (4 × π × mitochondrial area)/(mitochondrial perimeter) [2]. ** T‐test p < 0.01, (N = 3 in each group).

EXPRESSION / LABELING:
Gene:
Antibody:
Fish:
Anatomical Terms:
Stage: Adult
PHENOTYPE:
Fish:
Observed In:
Stage: Adult

Impaired ubiquitin‐mediated protein degradation in the adult ngly1(−/−)fish brain. (A) Heat map presentation of RNA sequencing of zebrafish brains, red = downregulation and blue = upregulation, the scale indicates fold change values. (B, C) RT‐qPCR quantification of ube3a(B) and ubb(C) mRNA levels. ** T‐test p < 0.01, *** T‐test p < 0.001 (ngly1(+/+)n = 3, ngly1(−/−)n = 3, ube3a, ubb). (D) Western blot analysis of zebrafish brain with an antibody against poly‐ubb; β‐Actin was used as a loading control. (E) Quantification of western blot‐determined ubiquitinated protein levels. **T‐test p < 0.01 (ngly1(+/+)n = 9, ngly1(−/−)n = 9). Representative immunohistochemistry images of ngly1(+/+)(F) and ngly1(−/−)(G) zebrafish brains periventricular gray zone (PGZ) reacted with anti‐poly‐ubb antibody, (H) Percentage of ubiquitin deposit‐positive cells. ***T‐test p < 0.001 (N = 10 in each group). Red arrows indicate cells with ubiquitinated protein accumulation.

EXPRESSION / LABELING:
Genes:
Antibody:
Fish:
Anatomical Terms:
Stage: Adult
PHENOTYPE:
Fish:
Observed In:
Stage: Adult

Amyloid aggregation in adult NGLY1‐deficient zebrafish brains. Representative histological images of ngly1(+/+)(A, B, F, G) and ngly1(−/−)(C, D, H, I) zebrafish brain and optic tectum (TeO) reacted with an antibody against amyloid fibrils (AD) and Congo Red (FI), demonstrating significant aggregation of amyloid fibrils (black arrows) at the intracellular space of the mutant fish brain. Magnifications: (F, H): X10, (A, C, G, H): X20, and (B, D): X40. Scale bar: 100 μm. (E, J) Quantification of amyloid fibers by Immunohistochemistry and Congo Red staining, respectively. ***T‐test, p < 0.001 (N = 10 per group).

Schematic representation of ngly1(−/−)zebrafish phenotypes and brain abnormality. The NGLY1‐deficient zebrafish model features key NGLY1‐CDDG clinical hallmarks. Impaired ubiquitination and amyloid fibrils aggregation are involved in ngly1(−/−) brain pathology.

Acknowledgments
This image is the copyrighted work of the attributed author or publisher, and ZFIN has permission only to display this image to its users. Additional permissions should be obtained from the applicable author or publisher of the image. Full text @ J. Inherit. Metab. Dis.