|
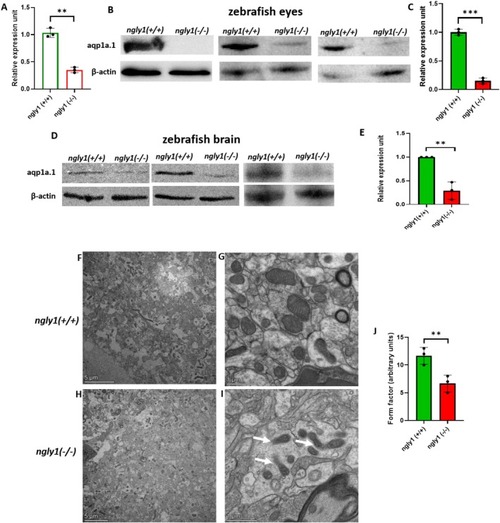
Adult ngly1(−/−)fish feature cellular effects resulting from NGLY1 deficiency. (A) RT‐qPCR quantification of aqp1a.1 mRNA levels in zebrafish eye. ** T‐test p < 0.01 (ngly1(+/+)n = 3, ngly1(−/−)n = 3). (B–E) Western blot analysis of aqp1a.1 protein from adult zebrafish eyes (B, C); *** T‐test p < 0.001 (ngly1(+/+)n = 3, ngly1(−/−)n = 3), and brain (D, E) ** T‐test p < 0.01 (ngly1(+/+)n = 3, ngly1(−/−)n = 3). β‐actin was used as a loading control. (F–I) Transmission electron microscopy images showing mitochondrial fragmentation in the mutant zebrafish brain (white arrows). (J) Fragmented mitochondria were quantified by Form Factor metric, calculated by the formula: Form Factor = (4 × π × mitochondrial area)/(mitochondrial perimeter) [2]. ** T‐test p < 0.01, (N = 3 in each group).
|