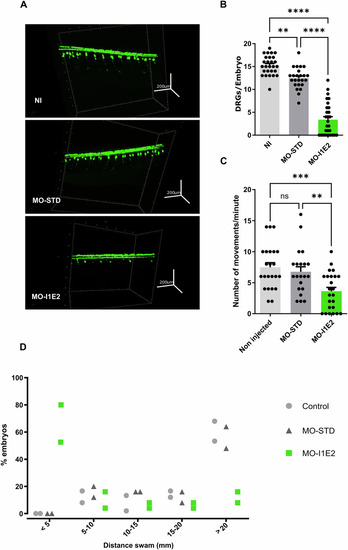
Flvcr1a expression was down-regulated in zebrafish using a splicing-blocking morpholino targeting the boundary of intron 1 and exon 2 (MOI1Ex2). As controls, both non-injected (NI) and standard morpholino-injected (MO-STD) zebrafish were used. A Representative images of NI, MO-STD, and MOI1Ex2 injected zebrafish. The GFP expression is under the control of the neurogenin1 (ngn1) promoter to visualize dorsal root ganglia (DRGs). Scale bar = 200 um. B Quantification of DRGs number in NI, MO-STD, and MOI1Ex2 injected zebrafish. Each dot represents the number of DRGs per single animal. n = 27 biological replicates for NI; n = 24 biological replicates for MO-STD; n = 29 biological replicates for MOI1Ex2. Data derived from N = 2 independent experiments. C Quantification of zebrafish spontaneous movements/minute of NI, MO-STD and MOI1Ex2 injected zebrafish. Each dot represents the number of movements per minute per single animal. n = 23 biological replicates for NI; n = 21 biological replicates for MO-STD; n = 25 biological replicates for MOI1Ex2. Data derived from N = 2 independent experiments. B, C One way ANOVA was performed. *= p < 0.05; ** = p < 0.01; *** = p < 0.001; **** = p < 0.0001. Error bars denote the standard error of the mean (SEM). D Distance swam (mm) following touch stimulation in NI-, MO-STD- and MOI1Ex2-injected zebrafish embryos. Data represents the percentage of embryos crossing each predetermined concentric circle. Each dot represents one independent experiment performed on 50 embryos. N = 2 independent experiments.
|
