
Fig. 5
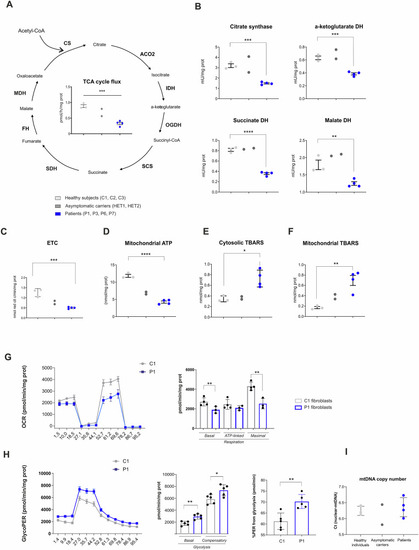
Primary fibroblasts derived from 4 patients carrying distinct disease-causing variants in the FLVCR1 gene (P1-P3-P6 and P7), 3 healthy individuals (C1, C2 and C3) and 2 asymptomatic carriers (HET1 and HET2) were analyzed. A Graphical representations of TCA cycle flux and enzymes. In the middle, TCA cycle measurement. B Activities of the main TCA cycle enzymes. C Total activity of the ETC measured as nmol of reduced cytochrome C /minute. D Mitochondria ATP content. E, F Measurement of cytosolic and mitochondrial Thiobarbituric Acid Reactive Substance (TBARS) as index of lipid peroxidation. Each dot in the graphs (A–F) represents a biological replicate. n = 3 biological replicates for healthy individuals; n = 2 biological replicates for asymptomatic carriers; n = 4 biological replicates for patients. An unpaired t-test was performed to compare healthy individuals and patients. *= p < 0.05; ** = p < 0.01; *** = p < 0.001; **** = p < 0.0001. Error bars in the graphs denote the standard deviation (SD). G Oxygen Consumption Rate (OCR) was measured in C1 and P1 derived fibroblasts using the Seahorse Mito Stress Test. The OCR was monitored during sequential injection of 1 μM oligomycin, 2 μM FCCP, and 1 μM rotenone plus 1 μM antimycin A. Calculated values for respiratory parameters are shown on the right. N = 4 independent experiments for C1; N = 3 independent experiments for P1. Basal: basal respiration. ATP-linked: ATP-linked respiration. Maximal: maximal respiratory capacity. (H) The glycolytic proton efflux rate (GlycoPER) was measured in C1 and P1-derived fibroblasts using the Seahorse Glycolytic Rate Assay. Calculated values for basal and compensatory glycolysis as well as the percentage of proton efflux rate (%PER) derived from glycolysis only, are shown on the right. n = 5 independent experiments. G, H One-way ANOVA analysis of variance or unpaired t-test was performed. * = p < 0.5; ** = p< 0.01; ***p = < 0.001; ****p = 0.0001. Error bars in the graphs denote the standard deviation (SD). I Mitochondria copy number assessed in controls, asymptomatic carriers, and patients derived fibroblasts. Each dot in the graph represents a biological replicate. n = 3 biological replicates for healthy individuals; n = 2 biological replicates for asymptomatic carriers; n = 4 biological replicates for patients. An unpaired t-test was performed to compare healthy individuals and patients. |