
Fig. 3
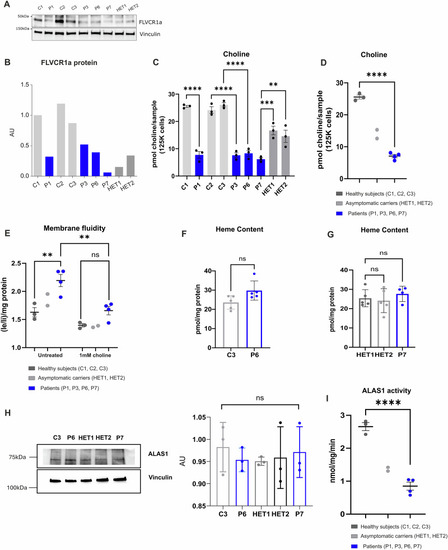
Primary fibroblasts derived from 4 patients carrying distinct disease-causing variants in the FLVCR1 gene (P1-P3-P6 and P7) were analyzed and compared to primary fibroblasts derived from 3 healthy individuals (C1, C2 and C3) and 2 asymptomatic carriers (HET1 and HET2). A, B Western Blot analysis of FLVCR1a expression levels. A representative image is shown together with the relative quantification of protein abundance. C Measurement of choline levels in each distinct individual. Each dot represents an independent experimental replicate. N = 3 independent experiments. One-way ANOVA analysis was performed. D Measurement of choline levels in patients, asymptomatic carriers and healthy individuals is shown. Each dot represents a biological replicate. n = 3 biological replicates for healthy individuals; n = 2 biological replicates for asymptomatic carriers; n = 4 biological replicates for patients. Unpaired t-test analysis was performed to compare healthy individuals and patients. E Measurement of membrane fluidity under basal conditions (Untreated) and upon choline supplementation (1 mM) for 16 hours. Each dot represents a biological replicate. n=3 biological replicates for healthy individuals; n = 2 biological replicates for asymptomatic carriers; n = 4 biological replicates for patients. Two-way ANOVA test was performed to compare healthy individuals and patients. F Measurement of heme content in P6 vs C3. Each dot represents an independent experimental replicate. N = 5 independent experiments. Unpaired t-test was performed. G Measurement of heme content in P7 vs HET1 and HET2. Each dot represents an independent experimental replicate. N = 5 independent experiments for HET1; N = 5 independent experiments for HET2; N = 4 independent experiments for P7. One-way ANOVA was performed. H Western Blot analysis of ALAS1 protein. A representative image is shown together with the relative quantification of protein abundance. Each dot represents an independent experimental replicate. N = 3 independent experiments. One-way ANOVA was performed. I Mitochondrial ALAS1 activity. Each dot represents a biological replicate. n = 3 biological replicates for healthy individuals; n = 2 biological replicates for asymptomatic carriers; n = 4 biological replicates for patients. T-test analysis was performed to compare healthy individuals and patients. *= p < 0.05; ** = p < 0.01; *** = p < 0.001; **** = p < 0.0001. Error bars denote the standard error of the mean (SEM). |