
Fig. 4
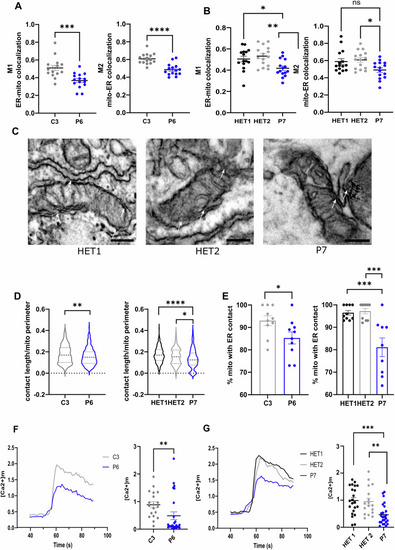
A, B Quantification of Manders coefficients (M1 and M2) on confocal images of fibroblasts expressing mt-DsRed and sec61-GFP, as a readout of the number of mitochondria-ER contact sites. Each dot represents a single cell. n = 15 biological replicates. Data derived from N = 2 independent experiments. An unpaired t-test was performed to compare P6 vs C3; one-way ANOVA was performed to compare P7 vs HET1 and HET2. C Representative images of transmission electron microscopy ER-mitochondria tethering details. White arrows indicate representative contact sites. Scale bars: 200 nm. D Violin plot of normalized ER-mitochondria contact length. The relative length is expressed as a ratio of contact length per mitochondrial perimeter. n = 260 biological replicates for C3; n = 240 biological replicates for P6; n = 221 biological replicates for HET1; n = 130 biological replicates for HET2; n = 174 biological replicates for P7; Data derived from N = 2 independent experiments. An unpaired t-test was performed to compare P6 vs C3; one-way ANOVA was performed to compare P7 vs HET1 and HET2. E Percentage of mitochondria in contact with ER. Each dot represents a biological replicate. n = 10 biological replicates for C3, P6, HET1 and HET2. n = 9 for P7. Data derived from N = 2 independent experiments. An unpaired t-test was performed to compare P6 vs C3; one-way ANOVA was performed to compare P7 vs HET1 and HET2. F, G Mitochondrial calcium uptake measured as Ca2+ responses to agonist stimulation with the cholinergic agonist carbachol in fibroblasts expressing mito-GEM-GECO1. Representative calcium traces are shown together with the quantification of peak mitochondrial Ca2+ amplitude in fibroblasts upon agonist stimulation. Each dot represents the peak amplitude of single cells. n = 19 biological replicates for C3; n = 25 biological replicates for P6; n = 22 biological replicates for HET1; n = 17 biological replicates for HET2; n = 31 biological replicates for P7. Data derived from N = 2 independent experiments. An unpaired t-test was performed to compare P6 vs C3; one-way ANOVA was performed to compare P7 vs HET1 and HET2. *= p < 0.05; ** = p < 0.01; *** = p < 0.001; **** = p < 0.0001. Error bars denote the standard error of the mean (SEM). |