FIGURE SUMMARY
Title

A human Tau expressing zebrafish model of progressive supranuclear palsy identifies Brd4 as a regulator of microglial synaptic elimination

Authors
Bai, Q., Shao, E., Ma, D., Jiao, B., Scheetz, S.D., Hartnett-Scott, K.A., Ilin, V.A., Aizenman, E., Kofler, J., Burton, E.A.
Source
Full text @ Nat. Commun.

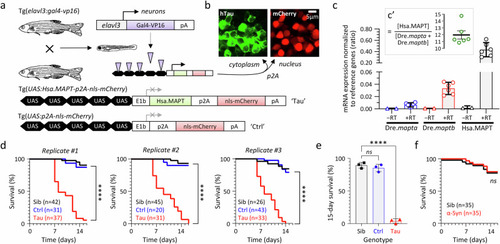
Reduced lifespan of transgenic zebrafish expressing human 4R/0N-Tau conditionally in neurons.

a Expression of human 0N/4R-Tau and an mCherry reporter conditionally in neurons of transgenic Tau zebrafish using Gal4/UAS genetics. The control UAS construct, which lacks the Hsa.MAPT transgene, is shown below for comparison. b Cytoplasmic expression of human 4R-Tau and nuclear expression of mCherry (to allow rapid non-invasive genotyping) as separate proteins from the same bicistronic hsa.MAPT-p2a-nls-mCherry mRNA. c Hsa.MAPT, Dre.mapta and Dre.maptb mRNA expression in Tau zebrafish, normalized to the reference genes Dre.bact1 and Dre.gapdh at 5dpf by real-time quantitative RT-PCR Each data point shows the mean of three technical replicates for a single biological replicate. Bars show mean ± SE of the six biological replicates. RNA samples that were not reverse transcribed (−RT) are shown as controls. The inset panel c’ shows the ratio of transgene Tau to the sum of the two endogenous paralogues in each biological replicate, bars show mean ±95% CI. See Supplementary Figs. S2S5 for details. d Survival curves for Tau zebrafish in comparison with non-expressing siblings (Sib), and Ctrl zebrafish expressing nls-mCherry only. Three replicate cohorts are shown, n for each experimental group is indicated in the graph legends. ****p < 10−15 Tau vs. Ctrl, or Tau vs. Non-Tg, Mantel–Cox test (Supplementary Table 4). e 15-day survival in the three biological replicate cohorts shown in panel d. Bars show mean ± SE, points show % survival for each replicate. ****p = 8.7 × 10−7, 1-way ANOVA with Dunnett’s multiple comparisons test. f Survival curves for zebrafish expressing human α-Synuclein (Syn; n = 35) from a similar UAS construct and under the same Gal4 driver as Tau zebrafish, in comparison with non-expressing siblings (n = 35). ns, not significant Syn vs. Sib, Mantel–Cox test (Supplementary Table 5). Source data are provided as a Source Data file.

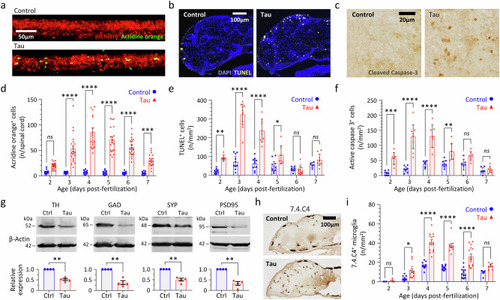
Neurodegeneration, synapse loss, and microgliosis in transgenic zebrafish expressing human 4R/0N-Tau.

af Three complementary methods demonstrating cell death in the CNS of Tau and Ctrl zebrafish from 2 to 7 days post-fertilization (dpf): a, d acridine orange labeling and intravital imaging of spinal cord (n = 12–22 zebrafish/group); b, e TUNEL labeling of brain sections (n = 6–10 zebrafish/group); c, f cleaved caspase 3 labeling of brain sections (n = 7–10 zebrafish/group). Example images from each method are shown in (ac), and quantification shown in df. Data points show cell counts from individual zebrafish (Ctrl, blue circles; Tau, red triangles). In e, f, each point is the mean of 10–12 sections for each individual zebrafish analyzed as shown in Supplementary Fig. S8. Bars show group mean ± SE. *p < 0.05, **p < 0.01, ***p < 0.001, ***p < 0.0001 Ctrl vs. Tau, 2-way ANOVA (genotype, age) with Šidák multiple comparisons test. g Western blots of lysates from pooled Tau or Ctrl larvae at 5dpf probed with antibodies to tyrosine hydroxylase (TH; dopaminergic neurons), glutamic acid decarboxylase (GAD; GABAergic neurons), synaptophysin (SYP; presynaptic terminals) or post-synaptic density protein 95 kDa (PSD95, post-synaptic terminals) and β-actin (loading control). Example blots are shown above, quantification of expression of each marker in Tau zebrafish (red triangles) relative to Ctrl (blue circles) is shown in four biological replicates below. Bars show mean ± SE, **p < 0.01 one sample 2-tailed t-test comparing Tau to normalized Ctrl value of 1. h, i Microgliosis in Tau zebrafish. Brain sections were labeled with antibody 7.4.C4 (a microglial marker; example images in h). Brain microglia were counted in serial sections from each zebrafish at time points 2–7 dpf as shown in Supplementary Fig. S8. Data points show mean for 10–12 sections from each individual Tau (red triangles, n = 4–15 zebrafish/group) and Ctrl (blue circles, n = 4–16 zebrafish/group) zebrafish, bars show group mean ± SE, *p < 0.05, ***p < 0.0001 Ctrl vs. Tau, 2-way ANOVA (genotype, age) with Šidák multiple comparisons test. Source data are provided as a Source Data file. Exact p values are shown in Supplementary Tables 610.

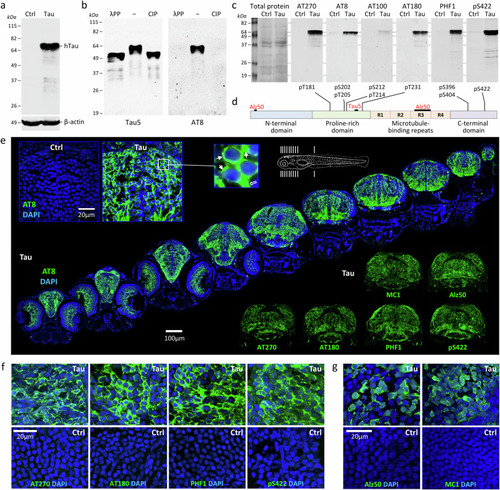
Human 4R/0N-Tau hyperphosphorylation, mislocalization and misfolding throughout the CNS of transgenic Tau zebrafish.

a, b Western blots of zebrafish head region lysates at 3dpf. a Samples from Ctrl and Tau zebrafish, blot probed with antibodies to total human Tau and β-Actin. b Lysates from Tau zebrafish were pretreated with calf intestinal alkaline phosphatase (CIP), Lambda protein phosphatase (λPP), or no enzyme (−). The blot was probed with an antibody to total human Tau (left) and an antibody to human phosphorylated [pS202, pT205]-Tau (AT8; right). c Replicate western blots of lysates from Ctrl and Tau zebrafish were probed with a panel of antibodies specific to different phosphorylated human Tau epitopes. The total protein loading control is shown for the first blot (left; others identical). d Major domains of human 4R/0N-Tau are shown to illustrate the locations of epitopes detected by the antibodies used in this study. e Serial axial sections (planes indicated in schematic at top) through a Tau zebrafish at 5dpf labeled for human phosphorylated Tau (AT8; green) and a nuclear counter label (DAPI; blue). The inset panels top left show similar sections from Ctrl and Tau zebrafish at higher magnification; the expanded panel illustrates mislocalization of human phospho-Tau to the cell bodies of neurons (small arrows) in addition to physiological localization in axons (large outline arrow). The inset panels below right show sections labeled with antibodies to other human Tau phosphoepitopes and misfolding epitopes as indicated. f, g Confocal micrographs showing sections from Tau (upper row) and Ctrl (lower row) zebrafish brain at 5dpf, labeled with antibodies recognizing (f) phosphorylated human Tau (AT270, AT180, PHF1 and pS422; green) or (g) misfolded human Tau (Alz50 and MC1; green), and a nuclear counter label (DAPI; blue). Source data are provided as a Source Data file.

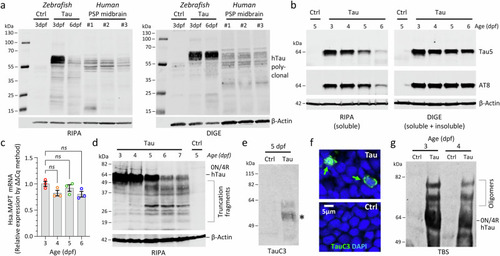
Loss of solubility, truncation, and oligomerization of Human 4R/0N-Tau in transgenic Tau zebrafish.

Proteins were extracted from Ctrl or Tau zebrafish pooled head regions, using RIPA (SDS/Triton), DIGE (7 M urea) or TBS (tris-buffered saline) for analysis by western blot. a Comparison of Ctrl and Tau zebrafish with postmortem midbrain samples from 3 different PSP patients. Blots probed with antibodies to total human Tau (above) and β-Actin (below). b Analysis of Tau zebrafish with increasing age. Blots were probed with antibodies to total human Tau (above), phosphorylated human Tau (AT8; middle) and β-Actin (below). c Real-time quantitative RT-PCR quantification of Hsa.MAPT mRNA in Tau zebrafish at 3–6 dpf. Each data point shows a biological replicate (calculated as mean of three technical replicates). Bars show group mean ± SE; ns not significant, 1-way ANOVA with Dunnett’s multiple comparisons test. d Western blot similar to b but run to resolve lower molecular weight proteins and probed with an antibody to human pS422-Tau. e Western blot of Tau and Ctrl zebrafish samples at 5dpf probed with antibody TauC3 that specifically recognizes human Tau truncated by Caspase-3 at residue D421. *Denotes bands with sizes suggestive of 0N/4R-Tau cleavage in Tau zebrafish. f Confocal micrographs showing sections from Tau and Ctrl brain labeled with the same TauC3 antibody used in e recognizing human Tau truncated at D421 (TauC3; green) and a nuclear counter label (DAPI; blue). Scattered labeled neurons in Tau zebrafish are indicated by green arrows. g Western blot of Ctrl and Tau zebrafish samples extracted by mechanical dissociation in tris-buffered saline without reducing agents or heating and probed with an antibody to total human Tau. The expected electrophoretic mobilities of monomeric human 0N/4R-Tau and additional high molecular weight forms corresponding to oligomers are indicated. Source data are provided as a Source Data file.

Hypokinetic motor phenotype in transgenic zebrafish expressing human 4R/0N-Tau.

ah Zebrafish motor function was evaluated at 5 dpf using automated tracking in 96-well plates35,36 under constant ambient illumination at 28 °C. a Plate image; inset shows features detected by the algorithm (well boundary, red; zebrafish, blue; zebrafish centroid, yellow). b Ctrl and Tau zebrafish (n = 48 each group) were compared in the same 96-well plate. Zebrafish centroid displacement at each video frame transition is scaled for each group to show mean speed (light gray traces). Colored markers (Ctrl, blue; Tau, red) show group mean ± SE within each 2-min time bin. ****p < 0.0001, Ctrl vs. Tau, 2-way repeated measures ANOVA with Šidák multiple comparisons test (Supplementary Table 11). ch Quantification of motor function in Ctrl and Tau zebrafish (3 combined biological replicates): c mean speed; d % time active; e inter-movement interval; f movement episode duration; g active swimming speed. Data points show individual zebrafish (Ctrl, n = 117; Tau, n = 130), bars show mean ± SE. ****p < 10−15, ***p = 3.1 × 10−10, **p = 5.3 × 10−8, Ctrl vs. Tau, 2-tailed unpaired t-test with Welch’s correction. h Histogram showing total distance traveled at different instantaneous speeds over the course of the assay. im Zebrafish responses to abrupt ambient light-dark transitions were evaluated at 5dpf at 1000 frames/s using a segmentation/kinematics application38. i ‘O’-bend illustrated by superimposing pseudocolored zebrafish silhouettes every 10 ms during the response. j Response rate (proportion of stimuli followed by motion within 1 s); k response latency (mean interval between stimulus and response onset); l maximum trunk curvature during ‘O’-bend response; and m peak truncal angular velocity (maximum rate of change of trunk curvature). Data points in im show mean responses of individual zebrafish (Ctrl, n = 68; Tau, n = 74), bars show group mean ± SE. ****p < 10−15, ***p = 7.3 × 10−9, ns not significant, Ctrl vs. Tau, 2-tailed unpaired t-test with Welch’s correction. Source data are provided as a Source Data file.

Optokinetic reflex abnormalities in transgenic zebrafish expressing human 4R/0N-Tau.

Optokinetic reflexes (OKR) were elicited at 5dpf and detected, measured, and analyzed using an automated tracking system40. a Single video frames showing the extremes of ocular position after presenting a nasotemporal (above) or temporonasal (below) stimulus to the left eye of Ctrl (left) or Tau (right) zebrafish. The ocular axes detected by the algorithm are shown in white. The difference between maximum and minimum angle is quantified as ocular range in panel d. b Example nystagmograms showing ocular angle (0 denotes long axis of eye parallel to y-axis of image) for the left (stimulated; solid line) and right (contralateral; broken line) eyes from Ctrl (blue; above) and Tau (red; below) zebrafish in response to successive 1-min periods of alternating (10 s each direction), nasotemporal, and temporonasal stimuli. c Comparison of the stimulus angular velocity (green) and the left eye angular velocity for Ctrl (blue; above) and Tau (red; below) zebrafish. High-velocity saccadic positional resetting movements (velocity exceeds axis limits) are indicated by ‘+’ in the Ctrl trace. The relationship between the stimulus and slow phase tracking movements is quantified as reflex gain in panel e. The frequency of saccadic movements is quantified in panel f. dh Quantification of OKR responses in Ctrl and Tau zebrafish. In each graph df, h, data points show individual zebrafish (Ctrl, n = 24; Tau, n = 23), bars show mean ± SE. d Ocular range (****p = 8.2 × 10−10, ***p = 3.3 × 10−5); e reflex gain (****p < 10−15); f saccade frequency (****p = 2.3 × 10−10, ***p = 5.3 × 10−6); (h) interocular gain (****p = 3.6 × 10−11); Ctrl vs. Tau, (df) 2-way ANOVA with Šidák multiple comparisons test, h 2-tailed unpaired t-test with Welch’s correction. g Proportion of zebrafish lacking high-velocity saccadic movements; bars show proportion ±95% CI, ***p = 0.000026, 2-sided Fisher’s exact test. Source data are provided as a Source Data file.

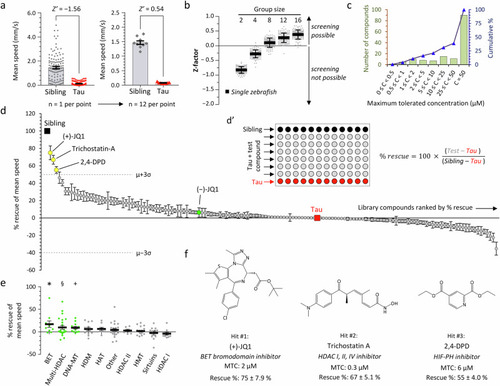
Small molecule screen to identify inhibitors of epigenetic readers, writer and erasers that rescue hypokinesia in transgenic zebrafish expressing human 4R/0N-Tau.

a Mean speed during the light phase of the visual motor response (VMR) in non-expressing siblings (Sib; n = 115) and Tau zebrafish (n = 130). Data points show individual zebrafish on the left graph and means of groups of 12 zebrafish on the right; bars show group mean ± SE on both graphs. b Z-factor (Z’) was calculated from the primary data shown in panel a, either for single zebrafish, or for groups containing 2–16 zebrafish, each in 100 different random groupings. Points show different groupings at each group size, bars show mean ±2 SD. c Binned distribution (green bars, left scale) and cumulative % distribution (blue line, right scale) of the maximum tolerated concentration (MTC) of 147 small molecule modulators of epigenetic readers, writers, and erasers in larval zebrafish. d Screen of 147 small molecule modulators of epigenetic readers, writers, and erasers for rescue of VMR light phase hypokinesia in Tau zebrafish exposed to compounds at MTC from 2dpf to 5dpf. Rescue calculated as shown in inset d’. Data points show % rescue ±SE for each compound (n = 12 zebrafish per data point), ordered by rank along the x-axis (details in Supplementary Table 15). The untreated Tau (0% rescue; n = 12) and Sib (100% rescue; n = 12) groups are indicated. Library mean rescue ±3 SD is indicated; compounds satisfying the a priori definition of a ‘hit’ (library mean +3 SD) are shaded yellow and labeled. (−)JQ1, the inactive stereoisomer of (+)JQ1, is shaded green for comparison. e Data from panel (d) grouped by biological target. Bars show group mean ± SE; targets showing significant rescue across compounds within a group are shaded green (*p = 0.042, §p = 0.028, +p = 0.013, group mean vs. rescue = 0; 2-tailed, one sample t-test). BET bromo- and extra-terminal domain containing proteins, HDAC histone deacetylases, DNA-MT DNA methyltransferases, HDM histone demethylases, HAT histone acetyltransferases, HMT histone methyltransferases, Other, targets listed in Supplementary Table 17. f Chemical structures, molecular targets, maximum tolerated concentrations, and activities of the three ‘hits’ identified by the screen. Source data are provided as a Source Data file.

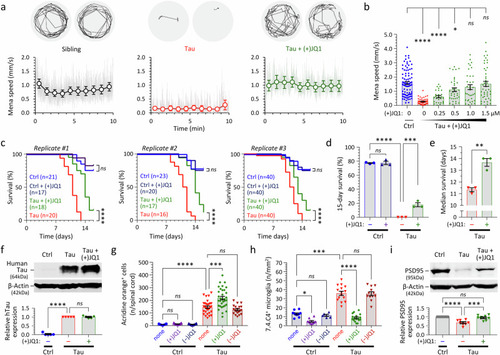
(+)JQ1 improves survival and rescues motor function, microgliosis, and expression of PSD95 in transgenic zebrafish expressing human 4R/0N-Tau.

Zebrafish were exposed to repurchased (+)JQ1 or (−)JQ1 from 2dpf. a VMR light phase swimming speed at 5dpf. Example 1-min vectors are shown above. The graphs below show mean group frame-to-frame displacement scaled to speed (gray) and 1-min binned group mean ± SE (colored markers), similar to Fig. 5b. b Relationship between mean speed during the light phase of the VMR at 5dpf and (+)JQ1 concentration; data points show individual zebrafish (n = 27–88 zebrafish/group, combined from 4 experimental replicates), bars show mean ± SE. ****p < 0.0001, *p < 0.05, 1-way ANOVA with Dunnett’s multiple comparisons test (Supplementary Table 18). c Zebrafish survival in three biological replicate cohorts. Group sizes are indicated in the graph legends. ****p < 0.0001, ns not significant, Mantel–Cox test (Supplementary Tables 19, 20). d 15-day % survival of the three cohorts shown in c. Bars show mean ± SE; ****p = 6.9 ×10⁻⁹, ***p = 0.00049, 1-way ANOVA with Šidák multiple comparisons test. e Median survival of [Tau] and [Tau + (+)JQ1] zebrafish from three cohorts shown in c. Bars show mean ± SE; **p = 0.0087, 2-tailed unpaired t-test. f Western blot showing expression of human Tau (above) and β-Actin (below) at 5dpf. Quantification of mean ± SE relative Tau expression in 5 biological replicate experiments is shown in the accompanying graph. ****p = 5.7 × 10−12, 1-way ANOVA with Dunnett’s multiple comparisons test. g Acridine Orange labeled spinal cord cells quantified as shown in Fig. 2a, d. Data points show individual zebrafish (n = 15–24 zebrafish/group), bars show mean ± SE. ****p < 10−15, ***p = 1.4 ×10⁻⁸, 1-way ANOVA with Šidák multiple comparisons test. h Microglia quantified at 5dpf, as shown in Fig. 2h, i. Data points show mean values for 10–12 sections from individual zebrafish (n = 5–17 zebrafish/group), bars show group mean ± SE. ****p < 10−15, ***p = 9.5 × 10⁻¹⁴, *p = 0.010, 1-way ANOVA with Šidák multiple comparisons test. i Western blot showing expression of PSD95 (above) and β-Actin (below) at 5dpf. Quantification of mean ± SE relative PSD95 expression in 8 biological replicate experiments is shown in the accompanying graph. ****p = 0.000018, ***p = 0.00035, 1-way ANOVA with Tukey multiple comparisons test. Source data are provided as a Source Data file.

(+)JQ1 inhibits microglial synaptic elimination in both transgenic zebrafish and rat primary culture models expressing human 4R/0N-Tau.

a Whole mount immunofluorescence for PSD95-immunoreactive post-synaptic puncta in the telencephalon (above) and optic tectum (below; approximate regions of images shown in low-magnification panel to right). Labeled brains were imaged by confocal microscopy. Maximum intensity projections are shown. PSD95-immunoreactive post-synaptic puncta were quantified in tissue volumes from (b) optic tectum and (c) telencephalon using unbiased automated image analysis algorithms. Data points show individual zebrafish (n = 17–43 zebrafish/group), bars show mean ± SE. ****p < 0.0001, ***p < 0.001, *p < 0.05, 1-way ANOVA with Šidák multiple comparisons test. d Fixed whole mount brains from [Tau or Ctrl] x Tg(mpeg1:egfp) zebrafish immunolabeled for GFP and PSD95 at 4dpf and imaged by confocal microscopy. Alpha shaded 3D projections of microglia are shown. The inset shows a single confocal plane from a Tau zebrafish, illustrating PSD95-immunoreactive synaptic material inside the cytoplasm of the microglial cell (arrow). e PSD95+ puncta quantified inside microglia in Ctrl, Tau, and [Tau + (+)JQ1] zebrafish as shown in panel d. Data points show individual microglia (n = 52–83 microglia from 6 zebrafish/group), bars show group mean ± SE. ****p < 0.0001, 1-way ANOVA with Tukey multiple comparisons test. f Primary embryonic rat cortex cultures were established under conditions promoting microglial survival and differentiation. Neurons were transfected to express human 0N/4R-Tau and membrane-anchored GFP (mGFP), or mGFP alone. Cultures were exposed to 1 μM (+)JQ1 (or vehicle only) and labeled for Iba1 (microglia; red), mGFP (transfected neurons; green), PSD95 (synaptic puncta; white), and DAPI (nuclei; blue). g PSD95+ puncta were quantified inside microglia (Supplementary Fig. S32) from each of the primary rat cortex cultures. Data points show individual microglia (n = 65–87 microglia from 3 biological replicates per group), bars show group mean ± SE. ****p < 0.0001, 1-way ANOVA with Šidák multiple comparisons test. Source data are provided as a Source Data file. Exact p-values shown in Supplementary Table 21.

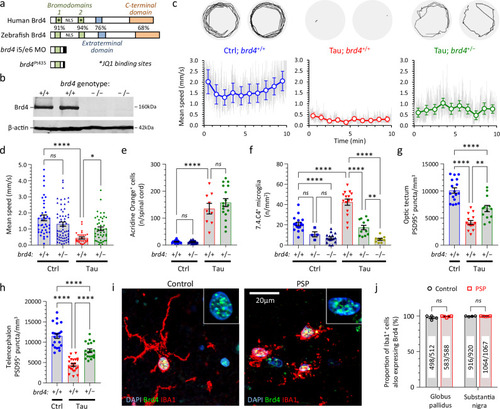
Brd4 regulates microgliosis and synaptic pruning in transgenic zebrafish expressing human 0N/4R-Tau and is expressed in human microglia.

a Schematic showing key functional domains of the human and zebrafish Brd4 orthologues. Amino acid homology is indicated for each domain. Truncated products formed by a splice site-targeting morpholino, or a stable germline 11-bp deletion in exon 4 of brd4 (pt435) are shown. b Western blot showing expression of Brd4 (above) and β-actin (below) in brains from WT and brd4Pt435/Pt435 (abbreviated to brd4−/−) zebrafish. c, d VMR light phase speed of [Ctrl], [Tau], and [Tau; brd4+/−] zebrafish. c Example 1-min swim vectors (above); mean speed during the light phase of the VMR (below). Gray traces show mean frame-to-frame displacement scaled to show speed, colored markers and bars show 1-min binned group mean ± SE, similar to Fig. 5b. d Mean speed of individual zebrafish (n = 28–62 zebrafish/group), bars show group mean ± SE. ****p = 2.9 × 10−7, *p = 0.029, 1-way ANOVA with Šidák multiple comparisons test. e Acridine orange labeled spinal cord cells quantified as shown in Fig. 2a, d. Data points show individual zebrafish (n = 9–24 zebrafish/group), bars show group mean ± SE. ****p = 3.2 × 10−11, 1-way ANOVA with Šidák multiple comparisons test. f Microglial density quantified as shown in Fig. 2h, i. Data points show individual zebrafish (n = 4–18 zebrafish/group), bars show mean ± SE. ****p < 0.0001, **p < 0.01, 1-way ANOVA with Šidák multiple comparisons test. g, h PSD95-immunoreactive synaptic puncta quantified in (g) optic tectum or (h) telencephalon. Data points show individual zebrafish (n = 13–22 zebrafish/group), bars show mean ± SE. ****p < 0.0001, 1-way ANOVA with Tukey multiple comparisons test. i Sections from control and PSP human substantia nigra labeled for Brd4 (green), Iba1 (microglia; red) and nuclei (DAPI, blue), and imaged by confocal microscopy. Inset panels show Brd4-immunoreactive microglial nuclei from the main panels at higher magnification. j The proportion of Iba1+ cells showing Brd4-immunoreactive nuclei in multiple sections of substantia nigra and globus pallidus from 4 control and 5 PSP cases. Data points show individual cases, bars show group mean ± SE, comparison by unpaired 2-tailed t-test. Numbers of [Brd4+, Iba1+]/[Iba1+] microglia analyzed in each group are indicated. Source data are provided as a Source Data file. Exact p-values for panels (fh) shown in Supplementary Table 22.

Acknowledgments
This image is the copyrighted work of the attributed author or publisher, and ZFIN has permission only to display this image to its users. Additional permissions should be obtained from the applicable author or publisher of the image. Full text @ Nat. Commun.