|
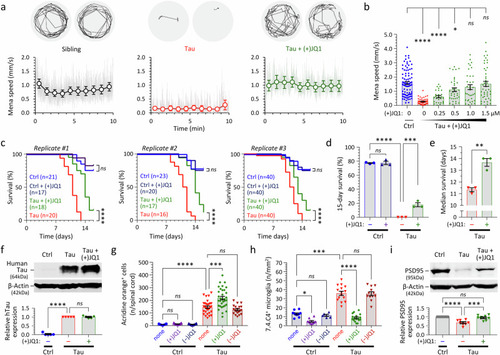
(+)JQ1 improves survival and rescues motor function, microgliosis, and expression of PSD95 in transgenic zebrafish expressing human 4R/0N-Tau. Zebrafish were exposed to repurchased (+)JQ1 or (−)JQ1 from 2dpf. a VMR light phase swimming speed at 5dpf. Example 1-min vectors are shown above. The graphs below show mean group frame-to-frame displacement scaled to speed (gray) and 1-min binned group mean ± SE (colored markers), similar to Fig. 5b. b Relationship between mean speed during the light phase of the VMR at 5dpf and (+)JQ1 concentration; data points show individual zebrafish (n = 27–88 zebrafish/group, combined from 4 experimental replicates), bars show mean ± SE. ****p < 0.0001, *p < 0.05, 1-way ANOVA with Dunnett’s multiple comparisons test (Supplementary Table 18). c Zebrafish survival in three biological replicate cohorts. Group sizes are indicated in the graph legends. ****p < 0.0001, ns not significant, Mantel–Cox test (Supplementary Tables 19, 20). d 15-day % survival of the three cohorts shown in c. Bars show mean ± SE; ****p = 6.9 ×10⁻⁹, ***p = 0.00049, 1-way ANOVA with Šidák multiple comparisons test. e Median survival of [Tau] and [Tau + (+)JQ1] zebrafish from three cohorts shown in c. Bars show mean ± SE; **p = 0.0087, 2-tailed unpaired t-test. f Western blot showing expression of human Tau (above) and β-Actin (below) at 5dpf. Quantification of mean ± SE relative Tau expression in 5 biological replicate experiments is shown in the accompanying graph. ****p = 5.7 × 10⁻¹², 1-way ANOVA with Dunnett’s multiple comparisons test. g Acridine Orange labeled spinal cord cells quantified as shown in Fig. 2a, d. Data points show individual zebrafish (n = 15–24 zebrafish/group), bars show mean ± SE. ****p < 10−15, ***p = 1.4 ×10⁻⁸, 1-way ANOVA with Šidák multiple comparisons test. h Microglia quantified at 5dpf, as shown in Fig. 2h, i. Data points show mean values for 10–12 sections from individual zebrafish (n = 5–17 zebrafish/group), bars show group mean ± SE. ****p < 10−15, ***p = 9.5 × 10⁻¹⁴, *p = 0.010, 1-way ANOVA with Šidák multiple comparisons test. i Western blot showing expression of PSD95 (above) and β-Actin (below) at 5dpf. Quantification of mean ± SE relative PSD95 expression in 8 biological replicate experiments is shown in the accompanying graph. ****p = 0.000018, ***p = 0.00035, 1-way ANOVA with Tukey multiple comparisons test. Source data are provided as a Source Data file.
|