|
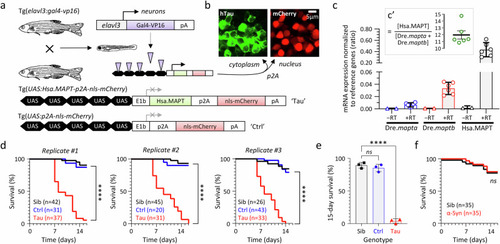
Reduced lifespan of transgenic zebrafish expressing human 4R/0N-Tau conditionally in neurons. a Expression of human 0N/4R-Tau and an mCherry reporter conditionally in neurons of transgenic Tau zebrafish using Gal4/UAS genetics. The control UAS construct, which lacks the Hsa.MAPT transgene, is shown below for comparison. b Cytoplasmic expression of human 4R-Tau and nuclear expression of mCherry (to allow rapid non-invasive genotyping) as separate proteins from the same bicistronic hsa.MAPT-p2a-nls-mCherry mRNA. c Hsa.MAPT, Dre.mapta and Dre.maptb mRNA expression in Tau zebrafish, normalized to the reference genes Dre.bact1 and Dre.gapdh at 5dpf by real-time quantitative RT-PCR Each data point shows the mean of three technical replicates for a single biological replicate. Bars show mean ± SE of the six biological replicates. RNA samples that were not reverse transcribed (−RT) are shown as controls. The inset panel c’ shows the ratio of transgene Tau to the sum of the two endogenous paralogues in each biological replicate, bars show mean ±95% CI. See Supplementary Figs. S2–S5 for details. d Survival curves for Tau zebrafish in comparison with non-expressing siblings (Sib), and Ctrl zebrafish expressing nls-mCherry only. Three replicate cohorts are shown, n for each experimental group is indicated in the graph legends. ****p < 10−15 Tau vs. Ctrl, or Tau vs. Non-Tg, Mantel–Cox test (Supplementary Table 4). e 15-day survival in the three biological replicate cohorts shown in panel d. Bars show mean ± SE, points show % survival for each replicate. ****p = 8.7 × 10⁻⁷, 1-way ANOVA with Dunnett’s multiple comparisons test. f Survival curves for zebrafish expressing human α-Synuclein (Syn; n = 35) from a similar UAS construct and under the same Gal4 driver as Tau zebrafish, in comparison with non-expressing siblings (n = 35). ns, not significant Syn vs. Sib, Mantel–Cox test (Supplementary Table 5). Source data are provided as a Source Data file.
|