|
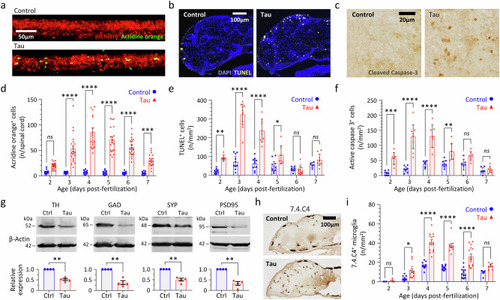
Neurodegeneration, synapse loss, and microgliosis in transgenic zebrafish expressing human 4R/0N-Tau. a–f Three complementary methods demonstrating cell death in the CNS of Tau and Ctrl zebrafish from 2 to 7 days post-fertilization (dpf): a, d acridine orange labeling and intravital imaging of spinal cord (n = 12–22 zebrafish/group); b, e TUNEL labeling of brain sections (n = 6–10 zebrafish/group); c, f cleaved caspase 3 labeling of brain sections (n = 7–10 zebrafish/group). Example images from each method are shown in (a–c), and quantification shown in d–f. Data points show cell counts from individual zebrafish (Ctrl, blue circles; Tau, red triangles). In e, f, each point is the mean of 10–12 sections for each individual zebrafish analyzed as shown in Supplementary Fig. S8. Bars show group mean ± SE. *p < 0.05, **p < 0.01, ***p < 0.001, ***p < 0.0001 Ctrl vs. Tau, 2-way ANOVA (genotype, age) with Šidák multiple comparisons test. g Western blots of lysates from pooled Tau or Ctrl larvae at 5dpf probed with antibodies to tyrosine hydroxylase (TH; dopaminergic neurons), glutamic acid decarboxylase (GAD; GABAergic neurons), synaptophysin (SYP; presynaptic terminals) or post-synaptic density protein 95 kDa (PSD95, post-synaptic terminals) and β-actin (loading control). Example blots are shown above, quantification of expression of each marker in Tau zebrafish (red triangles) relative to Ctrl (blue circles) is shown in four biological replicates below. Bars show mean ± SE, **p < 0.01 one sample 2-tailed t-test comparing Tau to normalized Ctrl value of 1. h, i Microgliosis in Tau zebrafish. Brain sections were labeled with antibody 7.4.C4 (a microglial marker; example images in h). Brain microglia were counted in serial sections from each zebrafish at time points 2–7 dpf as shown in Supplementary Fig. S8. Data points show mean for 10–12 sections from each individual Tau (red triangles, n = 4–15 zebrafish/group) and Ctrl (blue circles, n = 4–16 zebrafish/group) zebrafish, bars show group mean ± SE, *p < 0.05, ***p < 0.0001 Ctrl vs. Tau, 2-way ANOVA (genotype, age) with Šidák multiple comparisons test. Source data are provided as a Source Data file. Exact p values are shown in Supplementary Tables 6–10.
|