
- Title
-
Dehydroervatamine as a promising novel TREM2 agonist, attenuates neuroinflammation
- Authors
- Li, L., Xu, N., He, Y., Tang, M., Yang, B., Du, J., Chen, L., Mao, X., Song, B., Hua, Z., Tang, B., Lee, S.M.
- Source
- Full text @ Neurotherapeutics
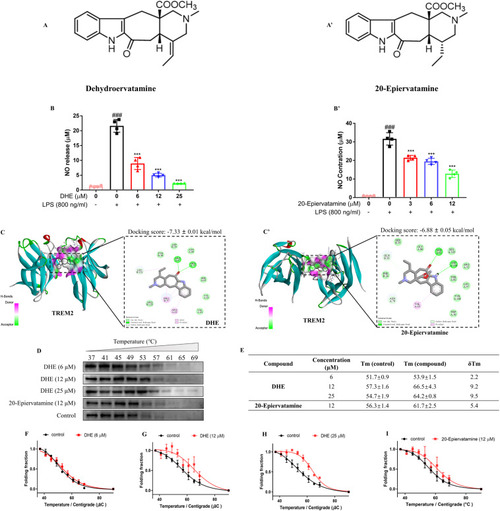
DHE directly bound to TREM2 to inhibit LPS-induced NO production in BV-2 microglial cells. (A, A′) Chemical structure of DHE and 20-Epiervatamine. (B, B′) The production of NO in the cell culture supernatant was determined by the Griess reagent assay; n = 4. (C, C′) Molecular docking of DHE (C) or 20-Epiervatamine (C′) to TREM2. (D) CETSA was carried out as described above. Cell lysates were analyzed by Western blotting. Representative images are shown. (E) The average Tm value of 6, 12, and 25 μM of DHE and 12 μM of 20-Epiervatamine. (F–I) The CETSA curves of TREM2 in BV2 cells were determined in the absence and presence of DHE (6, 12, and 25 μM) or 20-Epiervatamine (12 μM). Each band intensity of TREM2 was normalized with respect to that obtained at 37 °C. n = 3–4. Data are presented as mean ± SD analyzed by one-way ANOVA. ∗∗∗p < 0.001 vs. the LPS-treated group; ###p < 0.001 vs. the control group. |
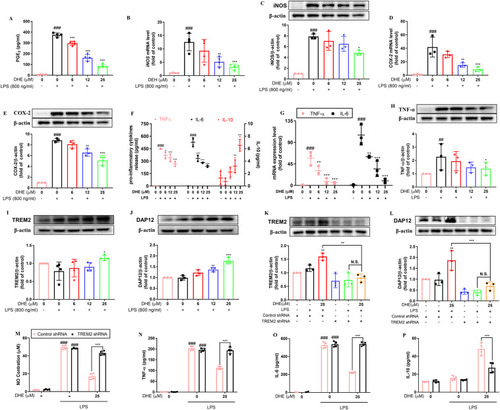
DHE suppressed LPS-induced activation of proinflammatory mediators and prevented the release of inflammatory cytokines by targeting TREM2. Cells were pretreated with DHE for 1 h and then exposed to LPS for another 24 h. (A) PGE2 production was determined by ELISA; n = 4. (B, D) The mRNA levels of iNOS and COX-2 were detected by RT-PCR analysis; n = 3. (C, E) Protein levels of iNOS and COX-2 were measured by Western blot analysis; n = 3. (F) Secretion levels of TNF-α, IL-6, and IL-10 in the cell culture medium were determined by relative ELISA; n = 4. (G) The mRNA levels of TNF-α and IL-6 were assessed by RT-PCR analysis; n = 3. (H) Protein levels of TNF-α were evaluated by Western blot analysis; n = 3. TREM2 (I) and DAP 12 (J) protein expression were detected by Western blot analysis and quantified by ImageJ. After TREM2 was knocked down using shRNA, microglial cells were treated with DHE in the presence or absence of LPS to determine TREM2 (K) and DAP12 (L) protein expression levels. The supernatant of BV2 cells was then used to measure NO production (M), TNF-α (N), IL-6 (O), and IL-10 (P) via Griess reagent and ELISA assay, respectively; n = 3–4. Data are presented as the mean ± SD analyzed by one-way ANOVA. ∗p < 0.05, ∗∗p < 0.01, and ∗∗∗p < 0.001 vs. the LPS-treated group; #p < 0.05, ##p < 0.01, and ###p < 0.001 vs. the control group; N.S. = not significant. |
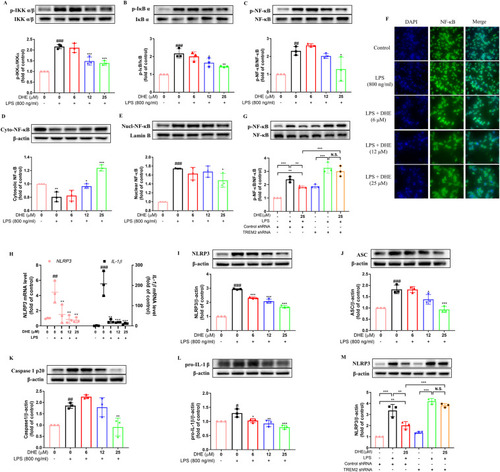
DHE inhibited the activation of NF-κB signaling and the NLRP3 inflammasome in LPS-treated BV2 microglial cells via TREM2 activation. Cells were pretreated with DHE for 1 h and then exposed to LPS for another 24 h. (A–D) The levels of total/phosphorylated IKKα/β (A), IκB α (B), and P65 (C) were measured by Western blot. (D–E) The expression levels of total NF-κB p65 in the cytoplasmic fraction (D) and nuclear fraction (E) were quantified by Western blot. (F) The nuclear translocation of p65 was evaluated by immunofluorescence analysis. Cells were stained with anti-p65 antibody (green) and DAPI (blue). (G) Cells were transfected with negative control shRNA or TREM2 shRNA, and then the NF-κB p65 expression level in BV2 cells after treatment with DHE or LPS was assessed by Western blot analysis. (H) The mRNA levels of NLRP3 and IL-1β were detected by RT-PCR analysis. (I–L) Protein levels of NLRP3 (I), ASC (J), cleaved caspase-1 (K), and pro-IL-1β (L) were measured by Western blot analysis. (M) Cells were transfected with TREM2 shRNA or a negative control shRNA, and after being treated with DHE or LPS, the level of NLRP3 expression in BV2 cells was determined by Western blot analysis (∗∗p < 0.01 and ∗∗∗p < 0.001 by the one-way ANOVA). Data are presented as the mean ± SD analyzed by one-way ANOVA. ∗p < 0.05, ∗∗p < 0.01, and ∗∗∗p < 0.001 vs. the LPS-treated group; #p < 0.05, ##p < 0.01, and ###p < 0.001 vs. the control group; N.S. = not significant; n = 3. |
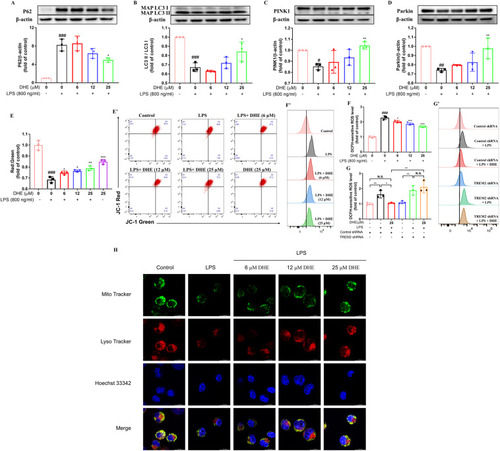
DHE promoted mitophagy and attenuated LPS-induced mitochondrial dysfunction in LPS-treated BV2 cells. Cells were pretreated with DHE for 1 h and then exposed to LPS for another 24 h. (A–D) Protein levels of P62 (A), LC3 (B), PINK1 (C), and Parkin (D) were measured by Western blot analysis. (E, E′) Mitochondrial membrane potential (MMP) was evaluated by flow cytometry after staining cells with JC-1. (F, F′) Intracellular reactive oxygen species (ROS) production was quantified by flow cytometry using DCFH-DA staining in BV2 cells. (G, G′) Following transfection of cells with TREM2 shRNA, intracellular ROS production in BV2 cells treated with DHE or LPS was assessed by flow cytometry (∗p < 0.05 and ∗∗p < 0.01 by the one-way ANOVA). (H) Representative colocalization images after LysoTracker staining for lysosomes and MitoTracker staining for mitochondria in BV2 cells treated with DHE (6, 12, 25 μM) and/or LPS. Data are presented as the mean ± SD analyzed by one-way ANOVA. ∗p < 0.05, ∗∗p < 0.01, and ∗∗∗p < 0.001 vs. the LPS-treated group, #p < 0.05, ##p < 0.01, and ###p < 0.001 vs. the control group; N.S. = not significant; n = 3. |
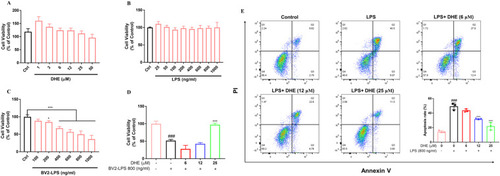
DHE exhibited neuroprotective effects on SH-SY5Y cells against LPS-stimulated microglia-mediated neurotoxicity. (A, B) SH-SY5Y cells were treated with the indicated DHE (A) or LPS (B) concentrations. (C) SH-SY5Y cells were treated with conditioned medium from BV2 cells that had been exposed to 25–1000 ng/ml of LPS for 24 h, and the cell viability was detected by the MTT assay. (D) SH-SY5Y cells were treated with condition medium from BV2 microglia exposed to LPS (800 ng/ml) for 24 h after pretreatment with DHE (6, 12, 25 μM) for 1 h. The cell viability was detected by the MTT assay. (E) SH-SY5Y cells were co-cultured with BV2 cells in the presence of DHE (6, 12, 25 μM) for 1 h, followed by LPS stimulation for 24 h. Apoptosis was quantified by flow cytometry. Data are presented as the mean ± SD analyzed by one-way ANOVA. ∗p < 0.05 and ∗∗∗p < 0.001 vs. the LPS-treated group, ###p < 0.001 vs. the control group; n = 3. |
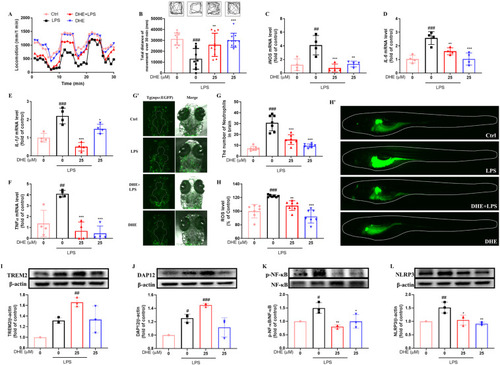
DHE ameliorated LPS-induced motor deficits and neuroinflammation via the TREM2 signaling pathway in the zebrafish larvae model. The 4 dpf zebrafish larvae were pretreated with DHE (25 μM) for 24 h, followed by LPS stimulation for an additional 24 h. (A) The total distances moved by the zebrafish larvae were plotted and recorded every minute for 30 min; n = 10. (B) The total behavioral locomotion distance over 30 min in zebrafish larvae was quantitatively analyzed, and the zebrafish swimming track was represented at the top; n = 10. (C–F) The mRNA expression levels of iNOS (C), IL-6 (D), IL-1β (E), and TNF-α (F) were analyzed by qPCR; n = 4. (G, G′) The neutrophil migration in the brain of Tg (Mpo:EGFP) zebrafish larvae was visualized (G′), and the number of neutrophils in the brain was quantified (G); n = 7. (H, H′) ROS levels were observed by fluorescence microscopy (H′) and quantified by image analysis (H); n = 7. (I–L) Protein levels of TREM2 (I), DAP12 (J), NF-κB (K), and NLRP3 (L) were determined by Western blot analysis; n = 3. The data are presented as the mean ± SD; ∗p < 0.05, ∗∗p < 0.01, and ∗∗∗p < 0.001 vs. the LPS-treated group; ##p < 0.01 and ###p < 0.001 vs. the control group. |