|
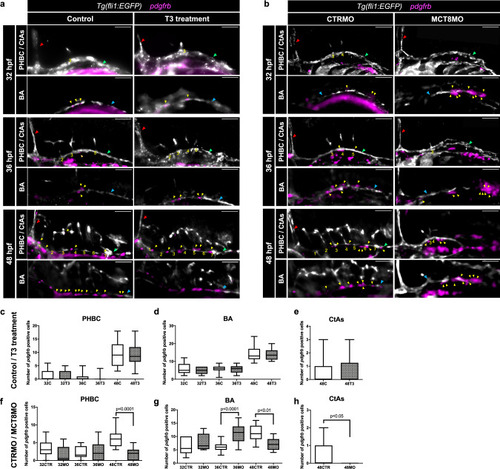
MT3 seems to affect indirectly pericyte number due to impaired development of the hindbrain vascular structures. Lateral view of Tg(fli1:EGFP) zebrafish embryos after WISH for pdgfrb (pericyte marker, magenta) and immunostained against GFP (endothelial marker, white) at 32, 36 and 48 hpf. Zebrafish embryos were submitted to two experimental conditions: a Increase of T3 (20 mM) availability in the medium (Control vs. T3 treatment) and b Knockdown of the Mct8 transporter by a morpholino-based system (CTRMO vs. MCT8MO). The red arrowhead indicates the mid-cerebral vein (MCeV), the green arrowhead indicates the primordial hindbrain channels (PHBC), the blue arrowhead indicates the basilar artery (BA), and the yellow arrowhead indicates pericytes. Yellow numbers 1-7 indicate the central arteries (CtAs) in their respective rhombomere. Scale bars: 100 µm. Quantification of the pericyte numbers in Control and T3 treatment condition in the c PHBC, d BA, and e CtAs at 32 hpf (n = 13, 11 (C, T3)), 36 hpf (n = 17, 14 (C, T3)) and 48 hpf (n = 20, 18 (C, T3)). Quantification of the pericyte numbers in CTRMO and MCT8MO condition in the f) PHBC, g) BA, and h) CtAs at 32 hpf (n = 14, 12 (CTRMO, MCT8MO)), 36 hpf (n = 15, 12 (CTRMO, MCT8MO)) and 48 hpf (n = 16, 11 (CTRMO, MCT8MO)). Data are presented as box-and-whisker plot, where the black thick horizontal line represents the median. The first and third quartiles are marked by the lower and upper edges of the boxes, respectively. Error bars represent standard deviations (smallest and highest value). Statistical significance determined by t-test p < 0.05. For detailed statistics, see Supplementary Data 2.
|