|
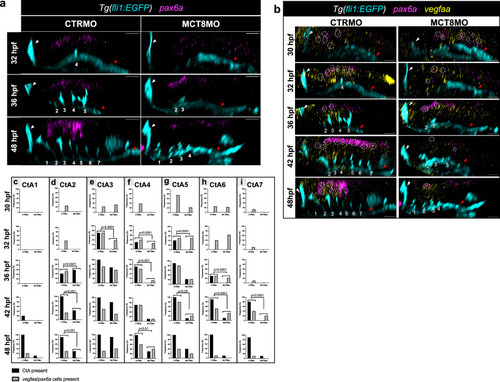
Ventral pax6a+ cells express vegfaa in the zebrafish hindbrain. aLateral view of Tg(fli1:EGFP) CTRMO and MCT8MO zebrafish embryos after WISH for pax6a (magenta) and immunostained against GFP (endothelial marker, cyan) at 32, 36 and 48 hpf are shown. The ventral population of pax6a expressing cells were lost in MCT8MO zebrafish embryos, compared to CTRMO embryos. bLateral view of Tg(fli1:EGFP) fluorescent maximum projection images of double WISH for pax6a (magenta) and vegfaa (yellow) and immunostained against GFP (cyan) in CTRMO and MCT8MO zebrafish embryos at 30, 32, 36, 42 and 48 hpf are represented. The hindbrain of CTRMO and MCT8MO zebrafish embryos were analyzed for colocalization of pax6a and vegfaa co-expressing cells (white dotted circles) during BHB development at different time points. Colocalization was determined by using the colormap colocalization plugin of Fiji software in the region of every CtA. The white arrowhead represents the mid-cerebral vein (MCeV), and the red arrowhead represents the primordial hindbrain channels (PHBC). Numbers 1 – 7 indicate the CtA in its respective rhombomere. Scale bar: 50 μm. During the different time points of hindbrain vasculature development (c-CtA1, d-CtA2, e-CtA3, f-CtA4, g-CtA5, h-CtA6, i-CtA7), the presence and absence of CtAs and pax6a/vegfaa co-expressing cells were analyzed and the frequency determined. CtAs 2, 4, 5 and 7 correlate with CtA development and vegfaa/pax6a co-expressing cells. Fisher’s exact test. n = 8 (30 hpf CTRMO, 32 hpf MCT8MO), 9 (30 hpf MCT8MO, 36 hpf MCT8MO), 10 (all other stages and conditions). For detailed statistics, see Supplementary Data 2.
|