|
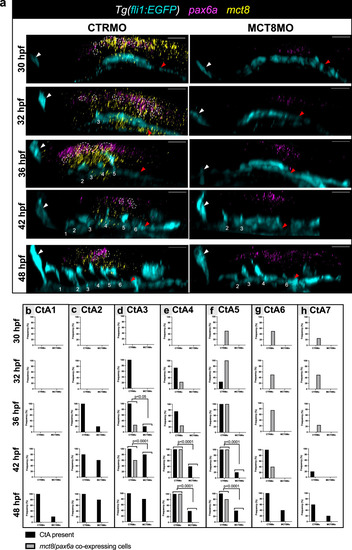
pax6a-expressing cells colocalize with T3 transporter mct8. a Lateral view of maximum projection images of fluorescent double WISH against pax6a (magenta) and mct8 (yellow) and immunostaining against GFP (endothelial marker, cyan) in Tg(fli1:EGFP) CTRMO and MCT8MO zebrafish embryos at 30, 32, 36, 42 and 48 hpf. The hindbrain of CTRMO and MCT8MO zebrafish embryos were analyzed for colocalization of pax6a with mct8-expressing cells (white dotted circles) during BHB development at different time points. Colocalization was determined by using the colormap colocalization plugin of Fiji software in the region of every CtA. The white arrowhead represents the mid-cerebral vein (MCeV) and the red arrowhead represents the primordial hindbrain channels (PHBC). Numbers 1 – 7 indicate the CtA in its respective rhombomere. Scale bar: 50 μm. During the different time points of BHB development, the presence and absence of CtA 1 (b), CtA 2 (c), CtA 3 (d), CtA 4 (e), CtA 5 (f), CtA 6 (g), CtA 7 (h) and pax6a/mct8 co-expressing cells were analyzed and the correlation was determined. Statistical significance was determined using Fisher’s exact test. n = 3 (36 hpf MCT8MO), 4 (30 hpf CTRMO/MCT8MO, 32 hpf CTRMO, 36 hpf CTRMO), 5 (32 hpf MCT8MO, 42 hpf CTRMO/MCT8MO, 48 hpf CTRMO/MCT8MO)). For detailed statistics, see Supplementary Data 2.
|