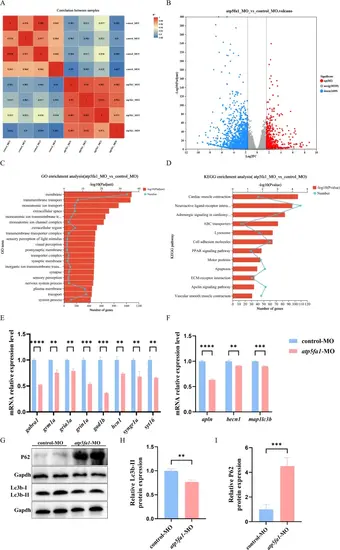
RNA-seq analysis of zebrafish model reveals the molecular regulatory network of atp5fa1 knockdown. A Transcriptome correlation analysis between samples (Pearson correlation coefficient heat map based on FPKM value). B Volcano plot of differentially expressed genes between control-MO group and atp5fa1-MO group. C Gene Ontology (GO) enrichment analysis of differentially expressed genes. D Kyoto Encyclopedia of Genes and Genomes (KEGG) enrichment analysis of differentially expressed genes between the control-MO group and the atp5fa1-MO group. E qPCR validation of neurotransmission-related genes (gabra1, grin1a, gad1b, gria3a, grm1a, hcn1, syngr1a, syt16) (mean ± SD, n = 15 embryos/group; **P < 0.01, *** P < 0.001, ****P < 0.0001, Student t-test). F qPCR validation of Apelin-autophagy relative genes apln, becn1, and map1lc3b (mean ± SD, n = 15 embryos/group; **P < 0.01, ***P < 0.001, ****P < 0.0001, Student t-test). G) Western blot analysis of autophagy-related proteins P62, Lc3b-I, and Lc3b-II in control-MO and atp5fa1-MO zebrafish larvae at 72hpf. H Quantitative analysis of Lc3b-II protein expression normalized to Gapdh (mean ± SD, n = 3; **P < 0.01, Student t-test). I Quantitative analysis of P62 protein expression normalized to Gapdh (mean ± SED, n = 3; ***P < 0.001, Student t-test)
|
