FIGURE

FIGURE 2

ID
ZDB-FIG-251216-20
Publication
Chen et al., 2025 - Ddx3xa mutations drive cardiac defects in a zebrafish model via dysregulation of wnt/β-catenin signaling
Other Figures
All Figure Page
Back to All Figure Page
FIGURE 2

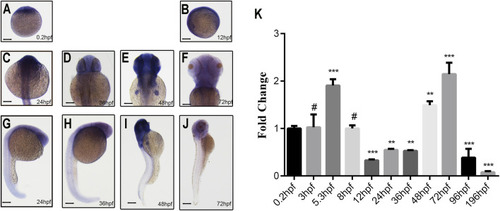
Spatiotemporal expression pattern of ddx3xa by whole-mount in situ hybridization and qRT-PCR analysis. (A–J) Spatiotemporal expression of ddx3xa at various developmental stages visualized by whole-mount in situ hybridization. Scale bar: 250 μm (applies to A–J). (A) 0.2 hpf; (B) 12 hpf; (C) 24 hpf; (D) 36 hpf; (E) 48 hpf; (F) 72 hpf; (G) Dorsal view, 24 hpf; (H) Dorsal view, 36 hpf; (I) Dorsal view, 48 hpf; (J) Dorsal view, 72 hpf. (K) Quantitative real-time PCR (qRT-PCR) analysis of relative ddx3xa transcript levels at various developmental time points (0.2, 3, 5.3, 8, 12, 24, 36, 48, 72, 96, 196 hpf). Expression levels were normalized to the 0.2 hpf time point. (n = 3; **P < 0.01, ***P < 0.001).

Expression Data
Gene:
Fish:
Anatomical Terms:
Stage Range: 1-cell to Days 7-13

Expression Detail
Antibody Labeling
Phenotype Data

Phenotype Detail
Acknowledgments
This image is the copyrighted work of the attributed author or publisher, and ZFIN has permission only to display this image to its users. Additional permissions should be obtained from the applicable author or publisher of the image. Full text @ Front Mol Biosci