|
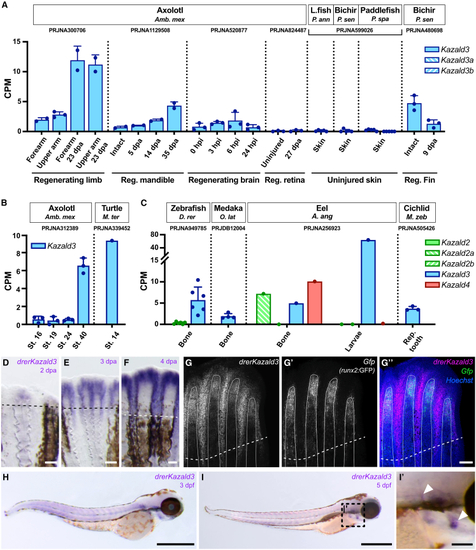
Kazald3 may have a connection to skeletogenesis and regeneration in teleost fish, but has no clear role in other lineages (A) Quantification of Kazald3 expression in regenerating limbs, lower jaw, brain, and retina of adult axolotl, the uninjured skin of non-tetrapod/teleost fish, and in regenerating fins of adult bichir. Kazald3 was duplicated in the lineage leading to paddlefish with no subsequent loss, creating Kazald3a and Kazald3b. L.fish = Lungfish. (B) Quantification of Kazald3 expression in whole embryos of developing axolotl and turtle. (C) Quantification of Kazald gene expression in the bone of adult zebrafish, bone of adult medaka, adult bone and the larvae of eel, and the developing tooth of the mbuna cichlid. Kazald2 was duplicated in the lineage leading to eel with no subsequent loss, creating Kazald2a and Kazald2b. (D–F) Whole-mount in situ hybridization of kazald3 in regenerating caudal fins of adult zebrafish from 2 to 4 dpa. Dashed line indicates the amputation planes. Scale bars, 100 μm. (G–G″) HCR of kazald3 (G), gfp (G′), and their overlap (G″) in 4 dpa regenerating caudal fin of adult runx2:GFP transgenic zebrafish. Dashed line indicates the amputation plane; solid white lines outline individual fin rays. Scale bar, 100 μm. (H and I) Whole-mount in situ hybridization of kazald3 in 3 (H) and 5 (I) dpf zebrafish embryos. Scale bars, 500 μm. (I′) Inset displaying the boxed region of the embryo in I. Arrowheads indicate areas of kazald3 expression that associate with the locations of ossifying skeletal elements (i.e., the opercle and cleithrum). Scale bar, 100 μm. PRJ IDs indicate the publicly available RNA-Seq datasets that generated the raw data for the listed tissues. Dots represent biological replicates in examined datasets, and error bars represent standard deviation when calculable. CPM = Counts Per Million, St. = stage, dpa = days post amputation, hpi = hours post injury, Reg. = regenerating, Rep. = replaced. Data are represented as Mean ± SD.
|