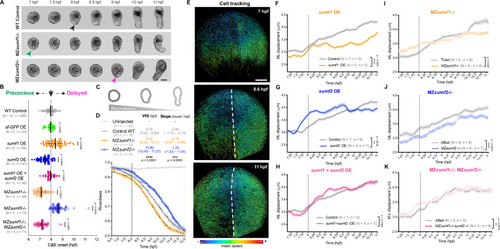
sumf1 and sum2 levels control the timing of C&E.
A Representative bright-field images of acvr1b* zebrafish explants of the indicated genotypes over time. Black, magenta, and green arrowheads indicate timely, precocious, and delayed onset of extension, respectively. Scale bar = 100 μm. B Onset of extension in acvr1b* explants of the indicated conditions. Dotted line shows typical extension onset of WT control explants around 8 hpf. Each dot represents a single explant. Means and standard deviation are indicated, N: number of independent experiments, n: number of explants, ***p < 0.001, ****p < 0.0001 compared with WT control group by Kruskal–Wallis and Dunn’s multiple comparisons tests. See Supplementary Movie 1. C Time-lapse series of explants were computationally segmented and explant roundness was quantified over time. Diagrams illustrate the progressive reduction in explant roundness during elongation (roundness = 1 indicates a perfect circle). D Roundness of explants of the indicated genotypes plotted over time. Means and standard error are indicated, N: number of independent experiments, n: number of explants. Curves were fitted using a sigmoidal model (black lines) and compared using an extra two-sided sum-of-squares F test (p < 0.0001). V50 and slope values are shown with 95% confidence intervals, *p = 0.003, **** p < 0.0001. All explants were generated from embryos of the AB background except for MZsumf1-/-, which are on the TU background, and MZsumf1-/-;MZsumf2-/-, which are on a mixed AB/TU background. E Representative images of automated nuclear tracking in the dorsal hemisphere of zebrafish gastrulae, starting before C&E onset (7 hpf). Tracks are color-coded by mean speed; dashed lines mark the dorsal midline; scale bar 100 μm. F–J ML cell displacement for WT control (gray lines) and sumf1 OE (F), sumf2 OE (G), sumf1 + sumf2 OE (H), MZsumf1-/- (I), MZsumf2-/- (J), and MZsumf1-/-; MZsumf2-/- (K) embryos. MZsumf2-/- and all OE embryos are on the AB background, MZsumf1-/- embryos are on the TU background, and each condition was compared to WT control embryos of their own genetic background. Each line represents mean and standard error of measured cells for all embryos of a given condition combined, N: number of independent experiments, n: number of embryos. Dotted line shows typical onset of convergence movements in WT control embryos around 8 hpf. ** p < 0.01, **** p < 0.0001 compared with WT control group by two-sided Wilcoxon signed-rank test. See Supplementary Movie 2. Source data are provided as a Source Data file.
|
